Nisha Thakre1, Kapil Khatri1, Satish Shilpi1*
Pharmaceutical Research Lab, Department of Pharmaceutics,
Ravishankar College of Pharmacy, Bhopal (MP) India
*Corresponding Author
Dr. Satish Shilpi
Pharmaceutical Research Lab, Department of Pharmaceutics,
Ravishankar College of Pharmacy, Bhopal (MP)
Email: shilpisatish@gmail.com
Phone: 09406520691
Abstract
Objective: The objective of the present investigation was to improve solubility of ezetimibe (EZE), results increasing its bioavailability. Materials and method: The solid dispersion of ezetimibe was prepared by solvent evaporation method by using different ratios of PVP K-30: PEG6000 (1:1:1, 1:1:2 and 1:1:3) respectively. Complex formation was authenticate by Powder X-Ray Diffraction (XRD) and differential scanning calorimetry (DSC) analysis. The prepared solid dispersion was further characterized for drug content, drug-polymer interactions, in vitro drug release and stability studies. Results: There was no any interaction found between drug and polymer and got a single thermogram of polymer that indicates the formation of complex. Powder X-Ray Diffraction (PXRD) revealed that no sharp crystalline peak was abstained because of conversion of solid mixture from crystalline to amorphous form. The prepared dispersion showed marked increase in the solubility as well as dissolution rate of ezetimibe in comparison of pure drug and the in vitro release studies revealed that there was an improvement in the dissolution characteristics of EZE in the form of solid dispersions. Conclusion: Solid dispersion with PEG 6000 and PVPK30 gave better rate and extent of dissolution. The best fit model indicating the probable mechanism of drug release from solid dispersions was found to be Koresmeyer peppas model. It can be concluded that PEG6000 and PVP K30 is suitable to prepare solid dispersions of ezetimibe to increase the solubility and bioavailability.
Keywords: Solubility, Bioavialability, Ezetimibe, PVP-K30, PEG6000, Solid dispersion
Introduction
Ezetimibe is a cholesterol absorption inhibitors of new class (BCS class II) for treatment of primary hypercholesterolemia are generally used in a monotherapy form or in combination with addition of statins. It inhibits the passage for dietary cholestrol and biliary cholesterol across the intestinal membrane without create any affect to absorption of bile acids, fat soluble vitamins and triglycerides. The bioabailability of Ezetimibes variable in different group of person (34-60%), the absolute bioavailability of ezetimibe has not been determined yet (Seth et al., 2011). In intention toward the present study making a solid dispersion of EZB for increase the drug solubility and rate of dissolution.
Generally new drug substances (approx. 40%) have slower rate of dissolution, low bioavailability with oral administration and poor water solubility as well as higher intra and inter subject variability. To overcome these problems associated with the solubility profile of drug candidate, by using the polymers like PEG 6000, PVP K30 and by involving solvent evaporation solid dispersions strategies are exploited. Kumar A et al ., Enhancement of the solubility and rate of dissolution of poorly water soluble drugs and drugs having low bioavailability can be done by a well known Process of fabricating solid dispersions technology (Chang R et al., 2000; Ingle et al., 2011). This study focuses on the use of solid dispersion technologies to improve the dissolution of poorly water-soluble drugs and in turn their oral bioavailability (Kumar et al., 2010; Pathak et al., 2011). By involving solid dispersion technique the enhancesthe solubility of drugs as well as bioavailability by reducing the dose regimen resulted to faster onset of action of drug. Solid dispersions technique is molecular dispersions of drugs by addition of a polymer in solid form, can be prepared by various methods such as solvent evaporation method and fusion method are widely used depending upon the requirement (Bhaskar et al., 2005; Chang et al., 2000).
Hypolipidemia is generally uncommon but secondary causes are relatively common compared to the rare primary hypolipidemic disorders. The hypolipidemia frequency depends upon the plasma cholesterol level is used to define the condition. National Health and Nutrition Examination Survey-I selected among the 1,479 men, the prevalence of hypocholesterolemia (<130mg/dl) was whites (1.8%) and blacks (3.6%). In another investigation involve the 772 fire-fighters blacks (3.6%) and whites (2.9%) were hypocholesterolemia both the surveys demonstrate racial differences in the prevalence of hypocholesterolemia as it is more likely to be seen in fallowing Etiology of disease (Dabbagh et al., 2007; Vippagunta et al., 2002; Chawla et al., 2008; Glueck et al., 1997).
Materials and methods
Materials
Ezetimibe was obtained as a generous gift sample from Cadila Laboratories, Ahmedabad, India. PEG 6000 and were obtained from Himedia Laboratory, Mumbai, India and all other reagents used were of analytical grade and obtained from S.D. Fine Chemicals, Mumbai, India.
Methods
Preparation of solid dispersions
Solid dispersion of EZB with PVPK30 and PEG 6000 different weight ratios 1:1:1, 1:1:2 and 1:1:3 respectively (Table 1) were prepared by the solvent evaporation method. Accurately weighed amount of drug and polymers in various ratios was dissolved in methanol in a round bottom flask and put on the orbital shaking incubator until it was completely dissolved and then leave open for evaporation of solvent at temperature of 40˚C. After complete evaporation of solvent white amorphous solid powder was obtained which was stored at a room temperature for 48 hrs in a vacuum oven for removal of residual solvent. The obtained dried solid dispersions were grinded in a pestle and mortar and then passed the powdered dispersion through sieve No. 60 and stored in desiccators for further use.
Table 1. Formulation of solid dispersion of Ezetimibe
|
Formulations |
F1 |
F2 |
F3 |
F4 |
F5 |
F6 |
F7 |
F8 |
F9 |
|
Drug (mg) |
20 |
20 |
20 |
20 |
20 |
20 |
20 |
20 |
20 |
|
PVP K-30 (mg) |
20 |
40 |
60 |
- |
- |
- |
10 |
20 |
30 |
|
PEG-6000 (mg) |
- |
- |
- |
20 |
40 |
60 |
10 |
20 |
30 |
Characterization of Solid Dispersion of Ezetimibe
Saturation solubility studies
The solubility studies of different solid dispersion formulations were conducted in 0.1 N HCl, distilled water, 0.05M acetate buffer pH 4.6, phosphate buffer 6.8 and 7.4 pH phosphate buffers. An excess amount of EZB solid dispersion was weighed and transferred into conical flasks which contain 10 ml of media. Mixture containing in conical flask was sonicated at room temperature for 15 min. After sonication the samples were agitated on shaker at room temperature for 48 h. The content was filter using Whatman filter paper, subsequently. After filtration the filtrate was diluted and analysed at wavelength of 232 nm using a double beam UV-Visible spectrophotometer.
FT-IR
Spectra were recorded using an FTIR spectrophotometer (Shimadzu, Japan). The samples (drug, carrier, and optimized formulation) were previously ground and mixed thoroughly with potassium bromide. The conjugation of solid dispersion performed in FTIR Spectra, recorded between 400 to 4000 cm-1 at a scan time 12 minutes (Figure 1).
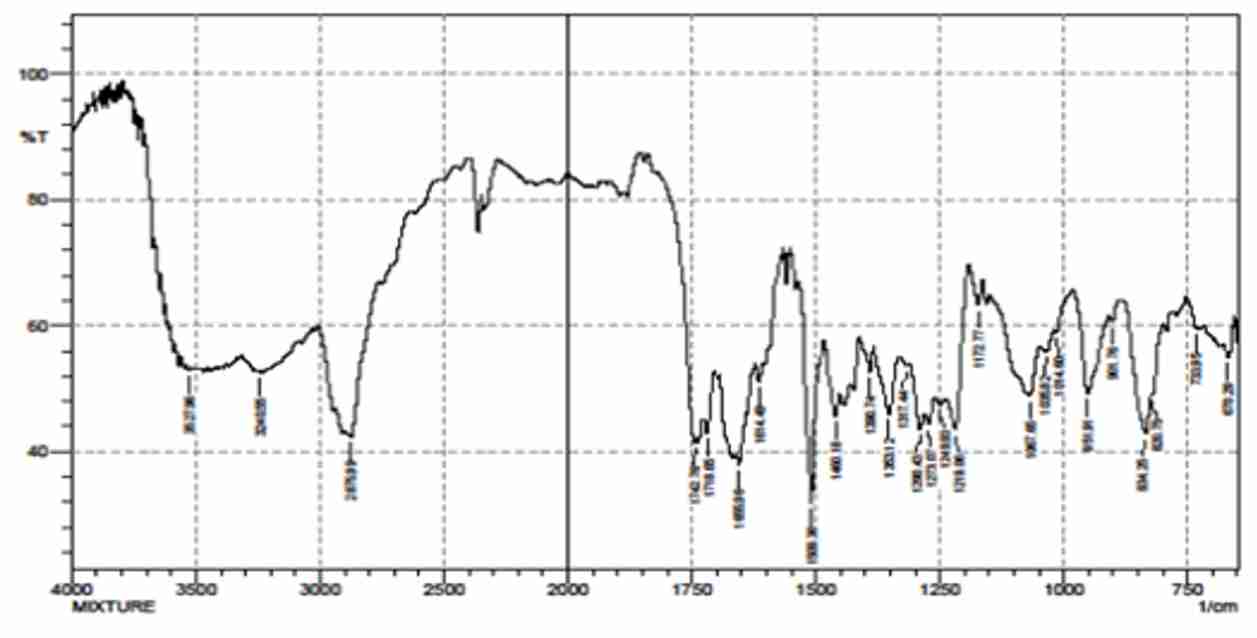
Figure 1. FT-IR spectra of solid dispersion of ezetimibe (optimized formulation: F8)
Differential Scanning calorimeter (DSC)
The thermo grams were recorded for drug, carrier, and physical mixture by using Differential Scanning Calorimeter (Shimadzu, Japan). A sample amount 2 to 4 mg was heated in aluminium standard pan at scanning rate of 20.0ml /min at temperature 30˚C to 350˚C under flow of nitrogen gas (Figure 2).
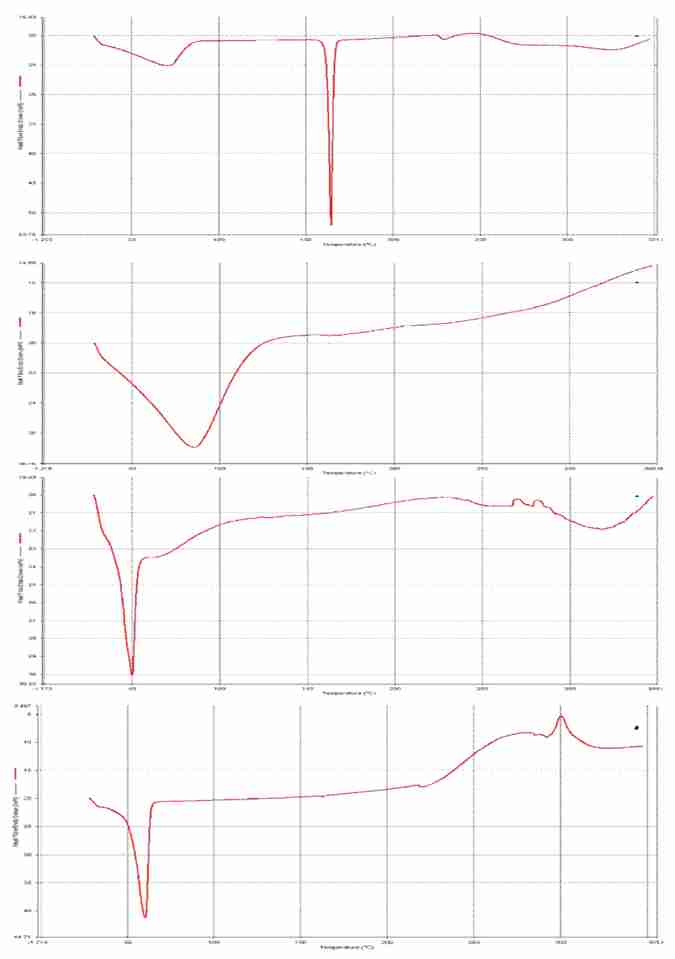
Figure 2. DSC thermograph (a) Ezetimibe (b) PVP K30 (c) PEG 6000 and (d) optimized formulation of Ezetimibe (Ezetimibe: PVP K30: PEG 6000)
Powdered X-ray diffraction (PXRD)
Sample were examined by wide angle XRD using a Philips 1710 X-Ray diffractometer (Philips Electronics Instruments Inc., USA) equipped with a copper target and nickel filter with the voltage of 40kV and the current of 40mA, samples were analysed ranging from 5˚ to 50˚ at a step size of 0.052-theta degree and a dwell time of 2 sec (Figure 3).
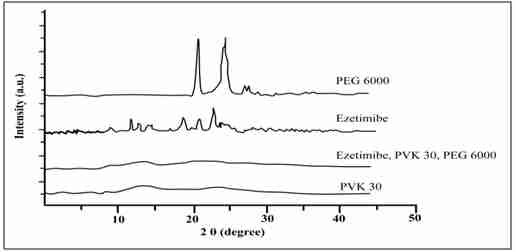
Figure 3. Powdered X-Ray diffraction (PXRD) of drug, polymer and optimize formulation
Drug Content
The prepared formulation of solid dispersion equivalents to 10 mg of Ezetimibe were taken and dissolved in methanol and filtered using 0.45µ membrane filters. Then the filtrate was diluted with buffer solution and analysed by UV spectrophotometer at 232nm. The percentage of drug content in was calculated by using fallowing formula.

Dissolution Study of Prepared Solid Dispersions
In vitro dissolution studies of prepared solid dispersions were carried out by using USP apparatus II (paddle). Add 10 mg of samples ezetimibe in 900 ml of 0.1N HCl at a internal temperature of apparatus 37±0.5°C and then stirred at 50 rpm. An aliquot of 5 ml was withdrawn at different time intervals and the withdrawn volume was replaced immediately with same volume of dissolution medium to maintain sink condition. The filtered samples were analysed spectrophotometrically at 232 nm. The drug release of mean of three readings was calculated.
Stability studies
The stability study of best formulation was done according to ICH guidelines. The closed packed samples (n=3) were stored for 3 months in the stability chamber which was maintained at 40±2°C and 75±5% RH. After 3 this duration, the samples were analyzed for assay and in vitro dissolution rate was determined.
Results and discussion
Saturation Solubility
The solubility studies were conducted in different media for all the prepared solid dispersion formulations and compared with pure drug. The solubility of solid dispersion formulations containing different polymer ratio was determined in different dissolution media i.e., 0.1 N HCl, distilled water, 0.05M acetate buffer 4.6 pH, phosphate buffer pH 6.8 and phosphate buffer pH 7.4 in saturation solubility study, solid dispersions showed grater solubility when compared to other drug: carriers ratio and as the carrier concentration increases (Table 2), with the action of solvent the solubility increased proportionally. From all the formulation, formulation F8 showed highest solubility i.e. 83.46±0.17µg/mL in distilled water, 78.34±0.18µg/ml in 0.1N HCl, and 90.4±0.88µg/ml in 0.05M acetate buffer pH 4.6 and it was 15-20 times solubility enhancement as compare to pure drug solubility. And it is due to the complete accumulation and physical complex formation of drug and polymer carrier. Highest solubility enhancement was found when polymers used in combination for example F7, F8 and F9. F8 was shows highest solubility because the concentration of polymer was optimum to accumulate and form complex with drug molecules (constant amount) as well as drug was molecularly distributed with the molecule of polymer by their solvent action (Table 1). In formulation F9, the solubility an increase similar to F8 formulation but solubility is remain constant or slightly change while using higher concentration of polymer. Hence F8 formulation selected as optimized formulation on the basis of their solubility enhancement.
Table 2. Solubility studies of Ezetimibe formulations (Solubility in μg/mL)
|
Dissolution Media |
Solubility in (μg/mL) |
|||||||||
|
Pure drug |
F1 |
F2 |
F3 |
F4 |
F5 |
F6 |
F7 |
F8 |
F9 |
|
|
0.1N HCL |
4.37±0.13 |
14.84±0.21 |
25.43±0.13 |
35.67±0.15 |
46.43±0.14 |
56.96±0.16 |
59.36±0.15 |
61.67±0.17 |
78.34±0.18 |
76.45±0.19 |
|
0.05M Acetate buffer pH 4.6 |
6.36±0.11 |
22.14±0.14 |
26.56±0.16 |
37.45±0.17 |
49.32±0.16 |
58.34±0.18 |
59.45±0.15 |
62.76±0.17 |
90.4 ± 0.88 |
90.4 ± 0.88 |
|
Phosphate buffer 6.8 |
5.34±0.16 |
19.58±0.15 |
24.46±0.16 |
35.76±0.18 |
46.14±0.19 |
57.33±0.18 |
59.45±0.17 |
60.24±0.16 |
88.65±.16 |
88.4±0.15 |
|
Phosphate buffer pH 7.4 |
4.47±0.14 |
18.75±0.15 |
21.83±0.16 |
33.45±0.17 |
40.23±0.18 |
52.91±0.18 |
55.67±0.18 |
59.44±0.17 |
85.38±0.17 |
85.67±0.18 |
|
Distilled Water |
0.32±0.11 |
6.58± 0.13 |
14.64±0.12 |
18.53±0.14 |
23.54±0.15 |
28.67±0.17 |
33.12±0.18 |
46.67±0.18 |
83.46±0.17 |
83.47±0.16 |
FT-IR
The FTIR spectrum of pure ezetimibe and optimized formulation are shown in figure 1. The spectrum of ezetimibe showed characteristic bands at 3259.84 cm-1NH stretch 1˚,2˚ amines ,amides), 3021.62 cm-1 (C-H stretch aromatics) 2963.75cm-1 to 2875.99cm-1 (=C-H stretch alkenes), 2697.56 cm -1(H-C=O:C-H stretch aldehydes),1716.72 C=O cm-1stretch and formulation showed characteristic bands 3527 cm-1 O-H stretch, H bonded alcohols, phenols 3240 cm-1( N-H stretch 1˚, 2˚ amines, amides), 1742-1720 cm-1( C=O stretch ester, saturated aliphatic) FTIR spectrum of the formulation, drug and polymer showed no significant shift or reduction in intensity of peaks of ezetimibe at 2963.75cm-1 to 2875.99cm-1 (=C-H stretch alkenes) that studies indicated the drug is compatible with polymer (Figure 1).
Differential Scanning Calorimeter
The thermograms of the EZB, PVPK30, PEG6000 and optimized formulation (F8 formulation) were shown in figure 2. The DSC thermograms of EZB exhibited physical mixture a sharp endothermal peak around 163.87°C corresponding to melting point. The DSC thermogram of PVPK30 exhibited a broad endothermal peak around 150°C corresponding to its melting point. The thermogram of PEG6000 exhibited a broad endothermal peak around 55˚C corresponding to its melting point. The thermogram of Drug: PVPK30:PEG6000 (F8 formulation) showed an endothermal peak in the region of PVPK30 and PEG6000 at 164.62˚C and disappear the endothermic peak of drug which indicate drug accumulated completely and disperse on molecular level in polymeric dispersion.
Powdered X-Ray Diffraction
P-XRD was used to identify the crystallinity of any substances. The P-XRD image of EZM, PEG 6000, PVP K30, and solid dispersion are shown in figure 3. The diffraction pattern of pure drug showed characteristic high intensity peaks at 8.9, 9.26, 10.04, 10.34, 11.66, 11.96, 16.82, 19.22, 21.38, 22.46, 23.06, and 23.48 confirms the drug in the crystalline form. Whereas PEG 6000 and PVP K30 shows few characteristic peaks in P-XRD differectogram. Optimized formulation (F8) shows no any peaks which indicate that the optimised formulation was amorphous form and totally loss the crystallinity. It is well reported in literature that amorphous form of any substances has high aqueous solubility in comparison of its crystalline form. In contrast, the characteristic peaks of EZM not found in solid dispersion pattern and solid dispersion’s pattern was similar with that of PEG 6000. In case of PVPK30 had two broad peaks in P-XRD pattern in the range of 5–15° and 15–25° (2θ), which confirm the amorphous nature of PVPK30. In the case of solid dispersion, no characteristic EZM peaks were observed. However, most characteristic peaks of EZM appeared in solid dispersion with lower intensity. The results indicated the formation of EZM-PVP K30-PEG 6000 solid dispersion, which was in amorphous form.
Drug content
The percentage drug content in formulation F8 & F9 was found 99.62±4.34% & 97.57±5.26% respectively which was higher as compare to formulation (Table 3). This indicated that ezetimibe was uniformly distributed and increasing in solubility of drug in optimized formulation (F8). In other formulation drug remaining to dissolve and amount not discover by drug content study.
Table 3. Drug content analysis after stability study of intermediate (IM) and accelerated (AC) conditions
|
Formulations |
Percent drug remaining |
|||||
|
0 months |
1months |
3 months |
||||
|
IM |
AC |
IM |
AC |
IM |
AC |
|
|
F1 |
82.45 |
82.45 |
82.22 |
82.35 |
82.12 |
82.25 |
|
F2 |
84..67 |
84.67 |
84.57 |
84.45 |
84.22 |
84.32 |
|
F3 |
86.23 |
86.23 |
86.14 |
86.32 |
86.32 |
86.04 |
|
F4 |
88.35 |
88.35 |
88.23 |
88.45 |
88.43 |
88.06 |
|
F5 |
92.85 |
92.85 |
92.75 |
92.85 |
92.03 |
92.06 |
|
F6 |
93.59 |
93.59 |
93.44 |
93.75 |
93.04 |
93.01 |
|
F7 |
96.34 |
96.34 |
96.12 |
96.22 |
96.01 |
96.2 |
|
F8 |
99.62 |
99.62 |
99.54 |
99.53 |
99.05 |
98.06 |
|
F9 |
97.57 |
97.57 |
97.45 |
97.65 |
97.01 |
98.9 |
Stability study
All the formulations (F1 to F9) were kept at intermediate and accelerated conditions in stability chamber in the closed container. A portion of the sample was taken out at 0, 1and 3 months and interval and tested them for drug content. The result in table 3 shows no significant changes in colour, odour and also in drug content. The highest percentage of degradation was observed in formulation F-9 after 3 months of storing in intermediate (30°C ± 2°C/65% RH ± 5% RH) and accelerated condition (40°C ± 2°C/75%; RH ± 5% RH). The loss was found 1.89% of its original drug content. Hence it can be said that the formulations are stable at wide variation in storage condition for long time.
Dissolution studies
The release profile for Only F8 formulations were fitted to zero order kinetics (cumulative % drug release vs. time plot) in Figure 4, first order kinetics (log% remaining to be released vs. time plot) and in Higuchi model (cumulative % release vs. square root of time plot) Hixon Crowell model (% release vs. square root of time plot) Korsmeyer peppas model (% release vs. square root of time plot). The results of release profile indicate that only 65% of drug dissolved after 15 minutes of dissolution study with pure drug. But the dissolution study of all solid dispersions of Ezetimibe shows higher dissolution than the pure drug after a definite time which indicates in enhancement of dissolution rate. If we compare the dissolution of solid dispersions of F8 formulation to dissolution of pure drug and other F1, F2, F3, F4, F5, F6, F7 and F9 formulation by solvent evaporation method, the F8 formulation gives higher dissolution (92.85±0.084) rate as compare to dissolution rate of respectively formulation, 40.46±0.47, 41.76±0.076, 48.34±0.089, 52.45±0.035, 55.27±0.078, 64.56±0.87, 67.68±0.05674.57±0.095, 88.85±0.056. The drug release data was fit to different kinetic model to understand the release mechanism. The linearity was found more comparatively Korsmeyer peppas (0.9935) and first order (0.9956) in plot than Higuchi, (0.9887), Hixon Crowell,(0.9809),and zero plot(0.8755), and release mechanism may follow diffusion from solid dispersion.
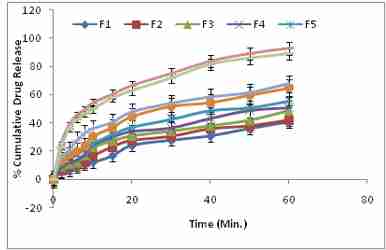 Figure 4. Cumulative percent drug release from different solid dispersion of Ezetimibe
Conclusion
In conclusion, solid dispersion of ezetimibe prepared by solvent evaporation method with PVPK30 and PEG600 showed better solubility and drug content. FT-IR, DSC and PXRD study showed no interaction was found between the drugs and polymer, and indicate the complex formation occur between drug and polymer and mixture was obtained as amorphous in nature. Saturation solubility studies shows that 15-20% aqueous solubility of drug is enhanced by solid dispersion in comparison to pure drug. The in-vitro dissolution investigation shows increases the rate of dissolution of solid dispersions then pure ezetimibe. Its ensure that the solid dispersion (SD) technique significantly improved the rate of dissolution of drug to a great extent. Finally it could be concluded that solid dispersion of Ezetimibe using hydrophilic polymers would improve the aqueous solubility, rate of dissolution thus enhancement of systematic bioavailability. In addition, these results indicate that dispersion technique can be an effective delivery system to improve the bioavailability of poor water soluble drugs like Ezetimibe.
Acknowledgement
One of the authors wants to acknowledge Cadila Pharmaceutical Ltd. Ahmedabad, India to provide gift sample of ezetimibe.
Conflict of interests
The authors declare that there is no conflict of interest.
References
Bhaskar C, Shyam S, Anant P. 2005. Preparation and evaluation of glibenclamide-polyglycolized glycerides solid dispersions with silicon dioxide by spray drying technique. European Journal of Pharmaceutical Sciences, 26: 219-230.
Chang R, Guo X, Burnside B, Couch RA. 2000. Review of fast dissolving tablets, Pharm Tech, 52-58.
Chawla G, Bansal AK. 2008. Improved dissolution of a poorly water soluble drug in solid dispersion with polymeric and nonpolymeric hydrophillic additives. Acta Pharmaceutica, 58: 257-274.
Dabbagh S, Taghipour B. 2007. Investigation of solid dispersion technique in improvement of physiochemical characteristics of ibuprofen powder. Iranian Journal of Pharmaceutical Sciences, 3: 69-76.
Glueck CJ, Kelley W, Gupta A, Fontaine RN, Wang P, Gartside PS. 1997. Prospective 10-year evaluation of hypobetalipoproteinemia in a cohort of 772 fire fighters and cross-sectional evaluation of hypocholesterolemia in 1,479 men in the National Health and Nutrition Examination Survey I. Metabolism, 46(6): 625-33.
Ingle US, Gaikwad PD, Bankar VH et al. 2011. A Review on solid dispersion: A dissolution enhancement technique. International Journal of Research in Ayurveda & Pharmacy, 2 (3): 751-757.
Kumar A, Sharma S, Kamble R. 2010. Self-emulsifying drug Delivery system (SEDDS): Future Aspect. International Journal of Pharmacy and Pharmaceutical Sciences, 4: 7-13.
Pathak D, Dahiya S, Phatak K. 2008. Solid dispersion of meloxicam factorial design dosages form for gastric population. Acta Pharmaceutica, 58: 99-110.
Seth NS. 2011. Formulation and evaluation of solid dispersion of olanzapine. International Journal of Pharmaceutical Sciences and Research, 2(2): 691-697.
Vippagunta SR, Maul KA, Tallavajhala S, Grant DJW. 2002. Solid state characterization of nifedipine solid dispersions. International Journal of Pharmaceutics, 2002; 236: 111–123.


