Hima Bindu Gujjarlamudi, Angel Jose, Rajesh Dupaguntla*
Department of Pharmacology,
Rajiv Gandhi institute of Medical Sciences, Ongole, Andhra Pradesh, India.
*Corresponding author
Rajesh Dupaguntla
Department of Pharmacology,
Rajiv Gandhi institute of Medical Sciences,
Ongole, Andhra Pradesh, India
Abstract
Objective: Hypertension is a chronic disorder requiring lifelong treatment. This study is done to find out the percentage variation of cost among different brands of angiotensin converting enzyme inhibitors (ACE inhibitors) and angiotensin receptor blockers (ARBs) used in hypertension. Materials and methods: The cost of a particular drug being manufactured by different companies, in the same strength and dosage forms, was referred from ‘‘Indian Drug Today (January - March 2017)”. The difference between the maximum and minimum prices of same drug was analyzed and percentage variation in the prices and cost ratio were calculated. Results: In Single drug therapy, among ACE inhibitors, Enalapril (5 mg) shows maximum price variation of 4748% and among ARBs, Valsartan (80 mg), has the price variation of 494.2 %. In combination therapies, Irbesartan + Hydrochlorothiazide (150 mg +12.5 mg) combination showed the maximum variation of 289.85 %. Conclusion: This study shows a wide variation in the prices of ACE inhibitors and ARBs. Prescribers should be aware of these variations and select cost effective drug to decrease the economic burden on population.
Keywords: Hypertension, cost analysis, price variation, cost ratio
Introduction
Hypertension is a long term medical condition resulting in high morbidity and mortality. It is an important risk factor for various diseases like coronary heart disease, stroke, congestive heart failure and impaired renal function (Kokiwar et al., 2012). WHO rates hypertension as one of the most important cause of premature death worldwide. Prevalence of hypertension in India is reported to vary from 4-15% in urban and 2-8% in rural population (Sandozi and Emani, 2010). The situation is more alarming as hypertension attributes for nearly 10% of all deaths (Patel V et al., 2011). Antihypertensive therapy reduces the risk of morbidity and mortality. According to eighth Joint National Committee (JNC 8) (James et al., 2014), Angiotensin converting enzyme (ACE) inhibitors and Angiotensin receptor blockers (ARBs) are the initial drugs of choice along with calcium channel blockers and thiazide diuretics for hypertension. ACE inhibitors are also recommended in patients with diabetes, cardiovascular disease (American Diabetes Association, 2010) as they have nephroprotective (Fioretto and Solini, 2005) and cardio protective properties.
There are many brands of the same drug available in Indian market with large difference in prices. The cost of medicines is a hurdle in treating the condition effectively. Due to lack of information on comparative drug prices and quality it becomes difficult for physicians to prescribe most economical treatment (Paunikar and Bhave, 2015). This affects the compliance and adherence to the treatment by the patients. Information generated from cost analysis studies will be helpful for both the doctors in choosing the correct medicine for their patients and for policy makers in successfully utilizing the available resources (Adama et al., 2003). So the present study was done to analyze the variation of cost among different brands of ACE inhibitors and ARBs available in the Indian market.
Materials and methods
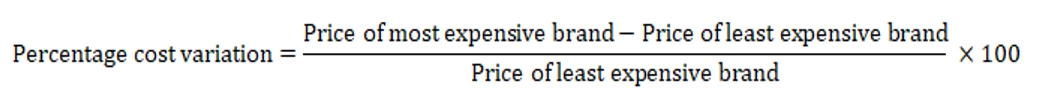
The study was done in the department of pharmacology of a teaching hospital in south India. Indian Drug Today (January - March 2017) was used to analyze the prices of ACE inhibitors and ARBs. The cost of a particular drug in the same dose and dosage forms being manufactured by different companies was compared. The cost of drugs in Indian rupee (INR) for 10 tablets was calculated for each brand. The difference between the maximum and minimum costs of the same drug manufactured by different pharmaceutical companies was calculated. The percentage cost variation and cost ratio were then calculated for each drug. The percentage variation in the cost of the drugs was calculated using the following formula (Jadhav et al., 2013).
Cost ratio is calculated by the ratio of most expensive brand to least expensive brand of the same drug (Singh, 2016). It helps to know how many times the most expensive formulation is costlier than the least expensive formulation of the same drug.
Exclusion criteria: The drugs manufactured by only one company; drugs with no cost information were excluded. Fixed dose combinations of more than two agents were also excluded.
Statistical analysis
The data collected was entered in Microsoft Excel 2007. Cost ratio and percentage cost variation were calculated. The data is represented in the form of tables and charts.
Results
The prices of total of 21 drugs (11 single and 10 combination preparations) belonging to ACE inhibitors and ARBs were analyzed. Percentage cost variation increases with increase in the no. of manufacturing companies.
Table 1 shows the price variation among ACE inhibitors. Maximum cost variation was seen with Enalapril 5mg (4748%) while Perindopril 4mg showed minimum cost variation of 44.2% (Figure 1). The cost ratio ranged from 1.44 for perindopril 4mg to 48.48 for Enalapril 5mg.

Figure 1. Percentage cost variation in ACE inhibitors
Table 1. Price variation among ACE inhibitors
|
Drugs |
Dose (mg) |
Min. price (INR) |
Max. price (INR) |
Cost ratio |
Cost variation (%) |
|
Captopril |
25 |
9.07 |
35 |
3.85 |
285.88 |
|
Enalapril |
2.5 |
0.51 |
20 |
39.21 |
3821.56 |
|
5 |
0.66 |
32 |
48.48 |
4748.5 |
|
|
10 |
12 |
48 |
4 |
300 |
|
|
Lisinopril |
2.5 |
13.5 |
50 |
3.7 |
270.37 |
|
5 |
25 |
100 |
4 |
300 |
|
|
10 |
39 |
114 |
2.92 |
192.3 |
|
|
Perindopril |
2 |
56.25 |
94 |
1.67 |
67.11 |
|
4 |
85 |
123 |
1.44 |
44.9 |
|
|
Ramipril |
1.25 |
14.91 |
44.3 |
2.97 |
197.11 |
|
2.5 |
26.5 |
79.8 |
3.01 |
201.13 |
|
|
5 |
38.57 |
128.8 |
3.32 |
233.93 |
|
|
10 |
63.5 |
179.3 |
2.82 |
182.36 |
Table 2. Price variations among ARBs
|
Drugs |
Dose (mg) |
Min. price (INR) |
Max. price (INR) |
Cost ratio |
Cost variation (%) |
|
Losartan |
25 |
10 |
38 |
3.8 |
280 |
|
50 |
19 |
62.5 |
3.28 |
228.94 |
|
|
Irbesartan |
150 |
78.56 |
240 |
3.05 |
205.49 |
|
300 |
168 |
199.65 |
1.18 |
18.83 |
|
|
Candesartan |
4 |
27 |
27.81 |
1.03 |
3 |
|
8 |
45.27 |
48 |
1.06 |
6.03 |
|
|
Valsartan |
80 |
69 |
410 |
5.94 |
494.2 |
|
160 |
130 |
500 |
3.84 |
284.61 |
|
|
Olmesartan |
20 |
70.5 |
90.1 |
1.27 |
27.8 |
|
40 |
109 |
161 |
1.47 |
47.7 |
|
|
Telmisartan |
20 |
12 |
50.66 |
4.22 |
322.16 |
|
40 |
18 |
85 |
4.72 |
372.22 |
Table 3. Price variations among combination therapy
|
Drugs |
Dose (mg) |
Min. price (INR) |
Max. price (INR) |
Cost ratio |
Cost variation (%) |
|
Enalapril + Hydrochlorothiazide |
10 +25 |
27.75 |
52.33 |
1.88 |
88.57 |
|
Lisinopril + Hydrochlorothiazide |
5 +12.5 |
42.5 |
52.1 |
1.22 |
22.58 |
|
Ramipril + Hydrochlorothiazide |
2.5 + 12.5 |
34.11 |
84.1 |
2.46 |
146.55 |
|
5 + 12.5 |
43.13 |
93 |
2.16 |
115.62 |
|
|
Losartan + Hydrochlorothiazide |
50 + 12.5 |
29 |
89 |
3.06 |
206.89 |
|
Losartan + Ramipril |
50 + 2.5 |
56.8 |
59.14 |
1.04 |
4.12 |
|
Losartan + Amlodepine |
25 + 5 |
32 |
53 |
1.65 |
65.625 |
|
50 +5 |
30 |
88.47 |
2.95 |
194.9 |
|
|
Irbesartan + Hydrochlorothiazide |
150 + 12.5 |
69 |
269 |
3.89 |
289.85 |
|
Olmesartan + Hydrochlorothiazide |
40 + 12.5 |
125 |
145 |
1.16 |
16 |
|
Telmisartan + Hydrochlorothiazide |
40 + 12.5 |
55 |
105 |
1.91 |
90.9 |
|
80 + 12.5 |
110 |
125 |
1.13 |
13.63 |
|
|
Telmisartan + Amlodepine |
40 + 5 |
55 |
101 |
1.83 |
83.63 |
Table 2 shows price variation in ARBs. Maximum cost variation was seen with Valsartan 80 mg (494.2 %) while Candesartan 4mg showed minimum cost variation of 3% (figure 2). The cost ratio ranged from 1.03 for Candesartan 4mg to 5.94 for Valsartan 80 mg.
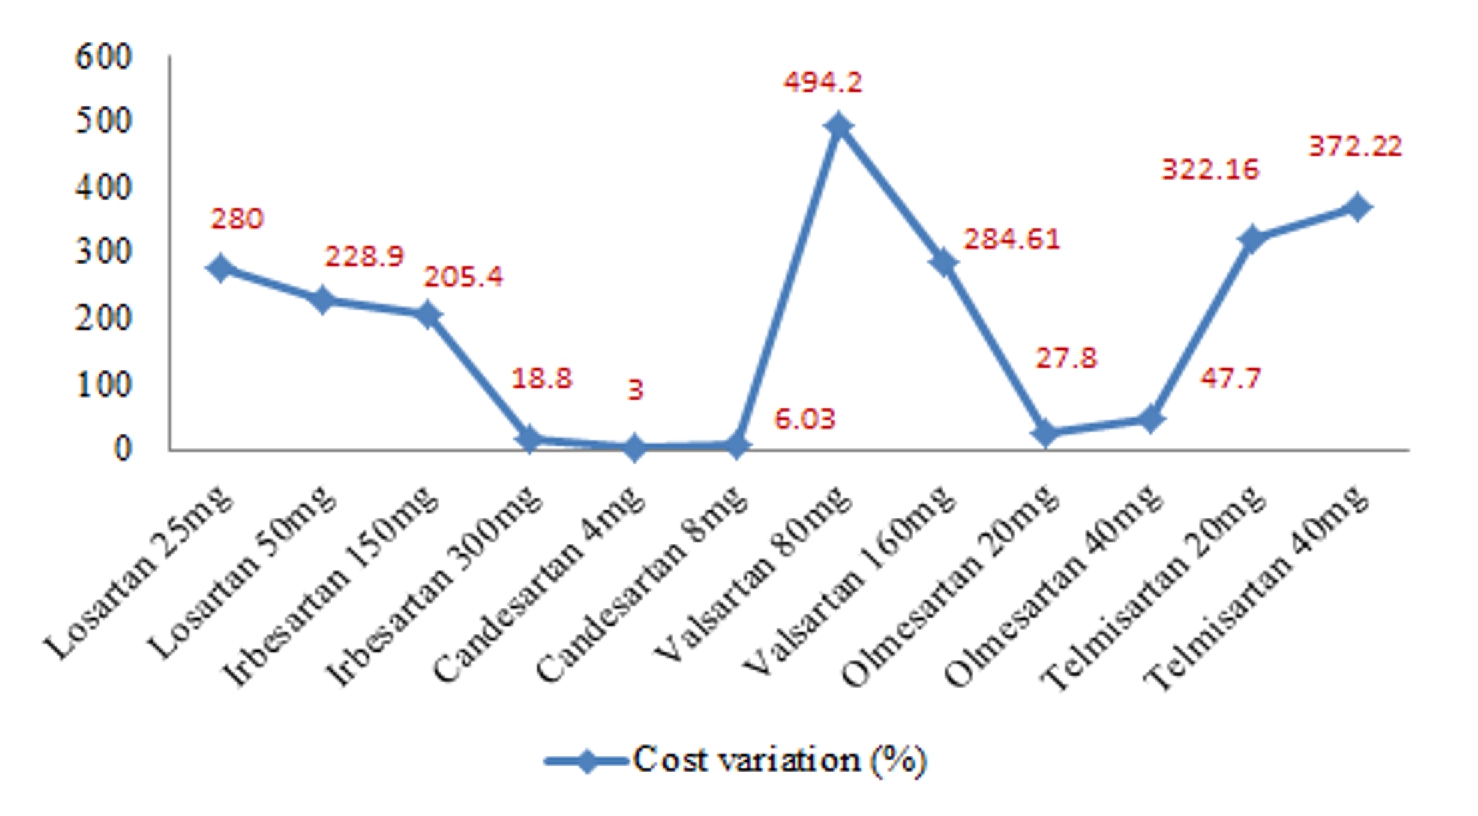
Figure 2. Percentage cost variation in ARBs
 Figure 3. Percentage cost variation in combination therapy
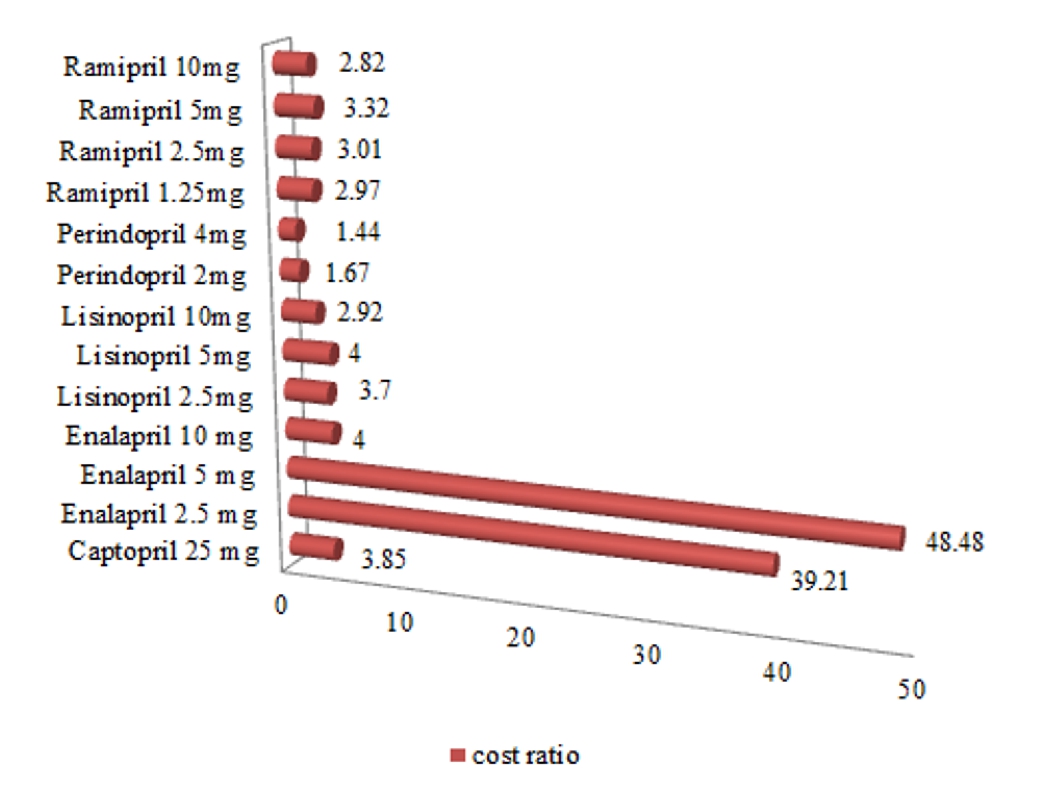
Figure 4. Cost ratio of ACE inhibitors
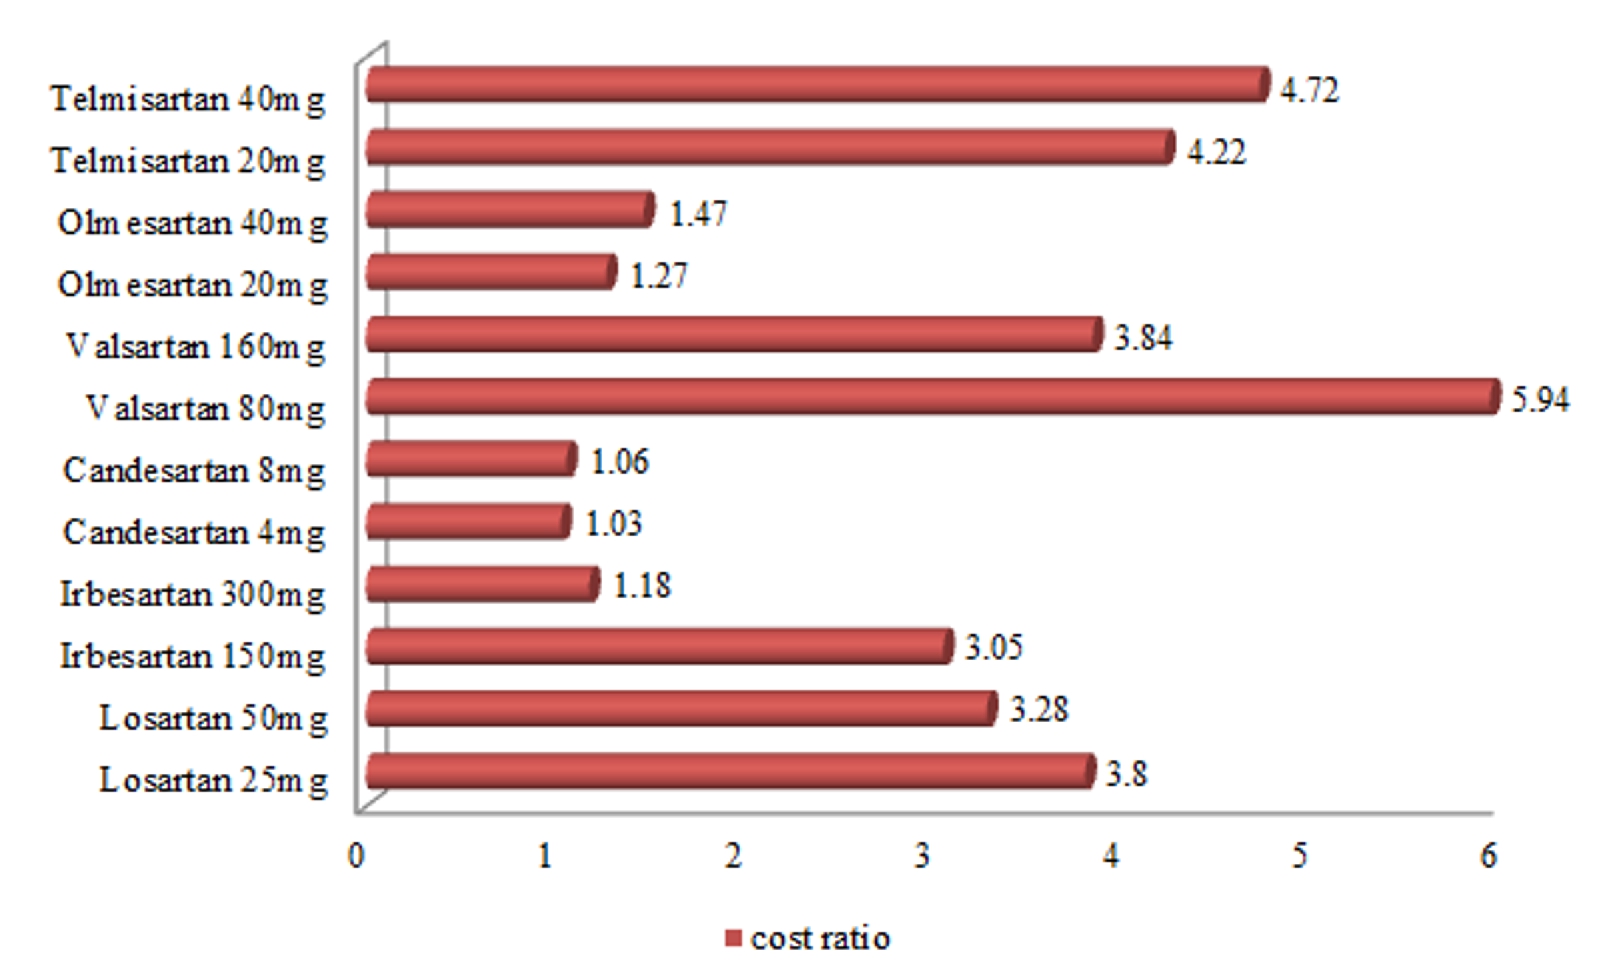
Figure 5. Cost ratio of ARBs
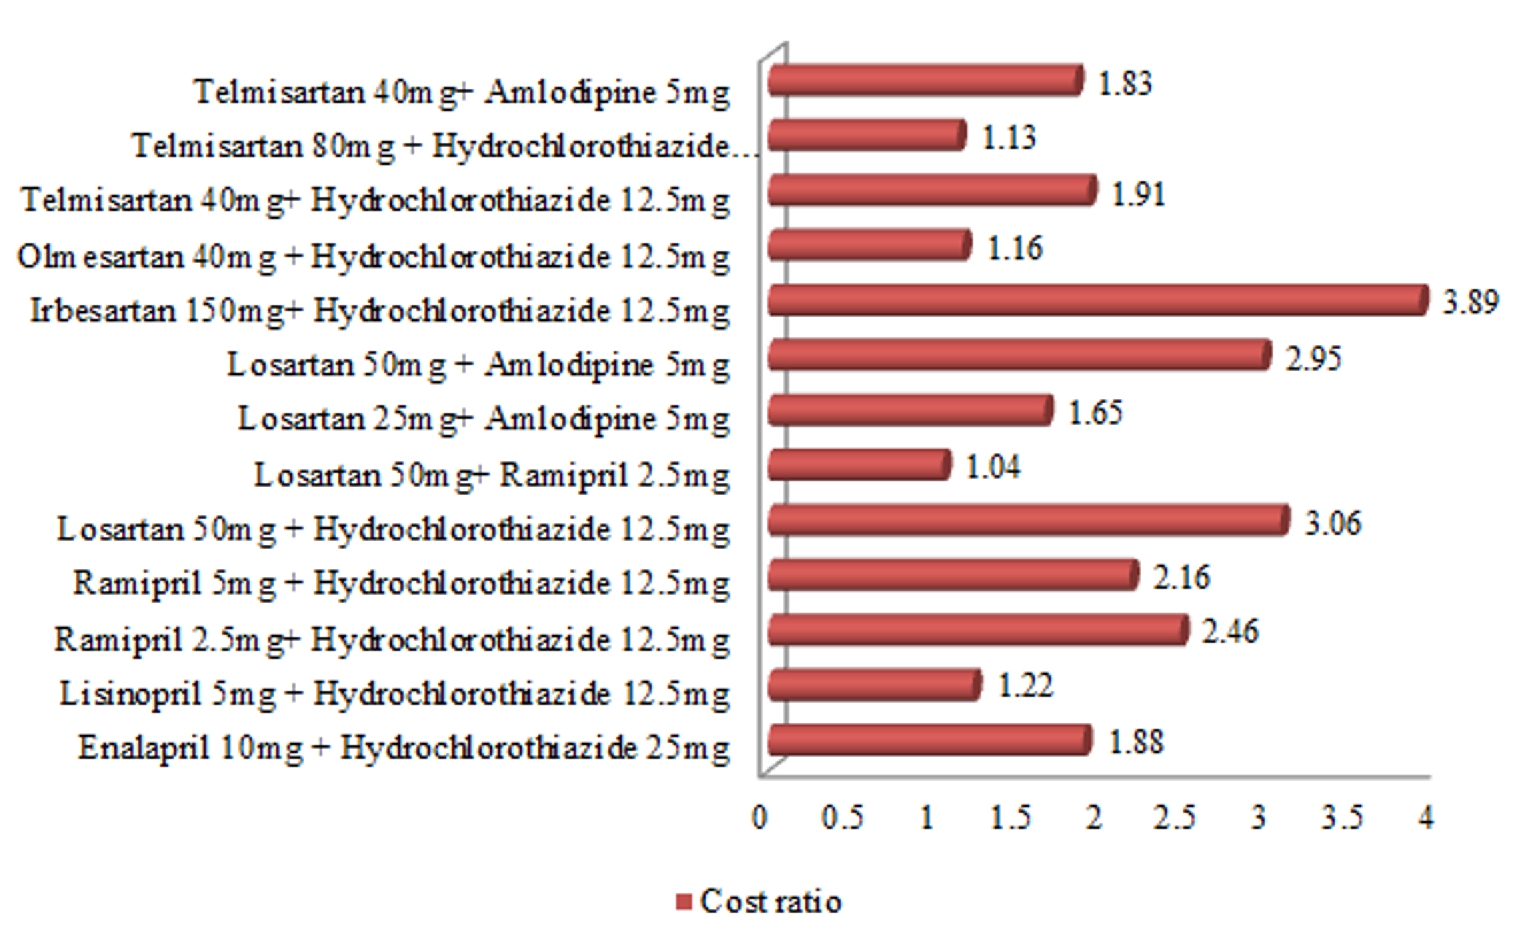
Figure 6. Cost ratio of combined therapy
Table 3 shows price variation in combination therapy. A total of 10 combinations were analyzed. In this Irbesartan + Hydrochlorothiazide (150 mg +12.5 mg) combination showed the maximum variation of 289.85 %, while Losartan + Ramipril (50 mg +2.5 mg) showed minimum variation of 4.12% (figure 3). Cost ratios of ACE inhibitors and ARBs as single therapy and combination therapy were given in figure 4, 5, 6 respectively.
Discussion
Hypertension is a chronic illness requiring long term treatment. The compliance of patient is significantly dependent on the cost of the prescribed medicines and higher cost means the compliance will be less (Rao, 2005). Selection of cost effective brand will improve the compliance and the consequence of the treatment.
There is a high fluctuation in the minimum and maximum price of ACE inhibitors and ARBs. The cost variation was above 100%. Among ACE inhibitors, Enalapril (5 mg) shows maximum price variation of 4748% and among ARBs, Valsartan (80 mg) has the price variation of 494.2 %. Other similar studies in oral antidiabetic drugs (Rajesh and Hima Bindu, 2017), antibiotics (Zubin, 2015), antihistamines (Singh, 2016) found similar results. These wide variations in the prices have severe economic implications. Unlike developed countries, more than 80% health financing is borne by patients in India (Creese et al., 2004, Mahal et al., 2010). Studies have shown that providing a manual of comparative drug prices annotated with prescribing advice to physicians reduced their patients’ drug expense especially in a disease like hypertension which needs long term treatment (Reichert et al., 2000).
The National pharmaceutical pricing authority (NPPA), of Government of India controls drug prices in Indian market. It fixes the ceiling price of a drug based on essentiality of a drug and the pharmaceutical companies fix the price for their products equal to or below the ceiling price for that formulation; however, they cannot sell any medicine given in the drugs prices control order (DPCO) list at a cost higher than that fixed under this order (Drugs Prices Control Order. 2017). The DPCO, 2017 list of price-controlled drugs includes Enalapril, Ramipril and Telmisartan. In our study the price variation even with the above drugs is high. Only 2 drugs out of the total 11 drugs i.e. Enalapril (2.5/5 mg) and Losartan (25/ 50/ 100 mg) were included in the WHO model list of essential Medicines (WHO model list of Essential Medicines 2017) while other drugs were not included in the list. There is a huge price variation of 4748% with Enalapril 5mg even though it is mentioned in WHO model list and DPCO.
Physicians should thus prescribe the low cost drugs and should not be influenced by pharmaceutical industries. Even though Medical Council of India have insisted on prescribing generic drugs as far as possible, doctors are not writing prescriptions containing only generic or unbranded chemical name of drugs. Often, the physicians and the patients prefer the expensive brand name drugs because they believe that the generic equivalent is inferior. The costly brand of same generic drug is scientifically proved to be in no way superior to its economically cheaper counterpart (Das et al., 2007). Comparative evaluation on quality of branded drug and its generic counterpart must be made mandatory for generic manufacturer. It is essential to take action by the government in regulating the prices which can be affordable by a common man.
Conclusion
There is a wide variation in the prices of different brands of ACE inhibitors and ARBs. They have an important role in management of hypertension especially associated with co-morbidities like diabetes, heart failure. The health care providers must be aware of the availability of low cost drugs and can select the cost effective ones based on the economic status of the patient. This reduces the economic burden on the patient and health care system.
Conflict of interest
The authors have no conflict of interest.
References
Adama T, Evans DB, Murray CJ. 2003. Econometric estimation of country – specific hospital costs. Cost Effectiveness and Resource Allocation, 26:1(1):3.
American Diabetes Association. 2010. Standards of medical care in diabetes–2010. Diabetes Care, 33 (Suppl. 1), S11–S61.
Creese A, Kotwani A, Kutzin J, Pillay A. 2004. Evauating pharmaceuticals for health policy in low and middle income country settings. In: Freemantle N, Hill S, editors. Evaluating pharmaceuticals for health policy and reimbursement. Massachusetts, USA: Blackwell Publication; (in collaboration with WHO Geneva); 227-43.
Das SC, Mandal M, Mandal SC. 2007. A critical study on availability and price variation between different brands: Impact on access to medicines. Indian Journal of Pharmaceutical Sciences, 69(1):160:3.
Drugs Prices Control Order. 2017. Available at: http:// www. nppaindia. nic. in/ DPCO 2017.pdf
Dupaguntla R, Gujjarlamudi HB. 2017. Pharmacoeconomic Evaluation of Oral Hypoglycemic Drugs Available In Indian Market. The Pharma Innovation, 6 (9):436-439.
Fioretto P, Solini A. 2005. Antihypertensive treatment and multifactorial approach for renal protection in diabetes. Journal of American Society of Nephrology, 16 (Suppl. 1):S18–S21.
Jadhav NB, Bhosale MS, Adhav CV. 2013. Cost analysis of study of oral antidiabetic drugs available in Indian market. International Journal of Medical Research and Health Sciences, 2(1):63-69.
James PA, Oparil S, Carter BL, Cushman WC, Dennison-Himmelfarb C, Handler J, Lackland DT, LeFevre ML, MacKenzie TD, Ogedegbe O, Smith SC Jr, Svetkey LP, Taler SJ, Townsend RR, Wright JT Jr, Narva AS, Ortiz E. 2014. Evidence-based guideline for the management of high blood pressure in adults: (JNC8). Journal of the American Medical Association, 311(5):507-20.
Kokiwar PR, Gupta SS, Durge PM. 2012. Prevalence of hypertension in a rural community of central India. Journal of the Association of Physicians of India, 60:26-29.
Mahal A, Karan A, Engelgau M. 2010. The Economic Implications of Non-communicable Disease for India. Health, Nutrition and Population (HNP) discussion paper. World Bank, Washington, DC. © World Bank.
Patel V, Chatterji S, Chisholm D, Ebrahim S, Gopalakrishna G, Mathers C, Mohan V, Prabhakaran D, Ravindran RD, Reddy KS. 2011. Chronic diseases and injuries in India. Lancet, 377:413-28.
Paunikar AP, Bhave KA. 2015. Cost analysis of oral antidepressant drugs available in India. National Journal of Physiology, Pharmacy and Pharmacology, 5 (5):367-371.
Rao KS, Nundy M, Dua AS. 2005. National commission on macroeconomics and health. Financing and delivery of health care services in India. New Delhi: Ministry of Health and Family Welfare, Government of India. Delivery of Health Services in the Private Sector, 89-104.
Reichert S, Simon T, Halm EA. 2000. Physicians' Attitudes about Prescribing and Knowledge of the Costs of Common Medications. Archives of Internal Medicine, 160:2799-2803.
Sandozi T, Emani VK. 2010. Survey of prescription pattern of anti-hypertensivedrugs in hypertensives & hypertension associated diabetics. International Journal of Pharma and Bio Sciences, 1(4):P23-26.
Singh AD, Kumar H. 2016. Cost analysis study of second generation antihistamines used in the treatment of allergic rhinitis in India. International Journal of Basic and Clinical Pharmacology, 5(4):1228-1233.
WHO model list of Essential Medicines (March 2017). Available at www.who.int/medicines/publications/essentialmedicines/20th_EML2017.pdf
Zubin S, Apurva D, Vishali L. 2015. Pharmacoeconomic study of various brands of antibiotic medication in India. World Journal of Pharmaceutical Research, 4(3):1600–6.


