Anand Kumar Patel, Vivek Jain, Sunil Kumar Jain, Amit Verma, Rupesh Kumar Jain*
Adina Institute of Pharmaceutical Sciences, NH, Bhopal Road, Sagar (M.P.), India – 470001
*Address for Corresponding Author
Mr. Rupesh Kumar Jain
Department of Pharmaceutics
Adina Institute of Pharmaceutical Sciences,
NH, Bhopal road, Sagar (M.P.), India – 470 001
Abstract
Colon is attracting interest as a site where poorly absorbed drug molecule may have an improved bioavailability. Additionally, the colon has a longer retention time and appears highly responsive to agents that enhance the absorption of poorly absorbed drugs. Objective: The main aim of the present research was to develop and evaluate various matrix tablet formulations of naproxen with different polymers. Material and methods: Naproxen tablets formulation was prepared for colon specific controlled release using combination of various polymer types (combination of EL100 and ES100), and (combination of EC with EL100 and ES100). Prepared tablets were characterized by physicochemical properties like weight variation, thickness, crushing strength, friability and drug content uniformity.In vitro release and kinetic studies were performed. Results and conclusion: In the present study, three formulations; viz., IEL15ES10, IEL10ES15 and IEL20EC5; were selected because they had shown good similarity with the theoretical target release profile in vitro as shown by their similarity factor f2 that was greater than 50 and dissimilarity factor f1 that was less than 15. The drug release profile from most of the selected formulations in simulated GI fluid (without enzymes) was characterized by an initial lag time period of 4-6 h with low drug release followed by controlled release phase in phosphate buffer media for about 14-16 h. Therefore, these formulations have the potential for pH and time dependent delivery to the colon.
Keywords: Matrix tablet, Colon targeting, Bioavailability, Controlled drug release, pH dependent delivery, Colon cancer
Introduction
Over the past few decades, with the emerging need for patient acceptability and compliance and the increasing number of new drug entities and biologicals becoming available as therapeutics, drug delivery has turned into core technology to derive market advantage in pharmaceutical industry. It has evolved from development and use of conventional oral and topical systems to sustained and novel drug delivery systems and currently focus attention on design and development of site specific or targeted delivery systems. Site specific delivery serves to deliver the drug at the site of action so that there is therapeutically effective concentration of drug available locally and thereby avoids the unwanted distribution of drug to other parts of the body. This would also help reduce the dose of the drug as well as prevent the occurrence of adverse effects due to its presence in systemic circulation (Vinarov et al., 2021).
Amongst all the routes of drug delivery, the oral route is the most preferred route on account of high patient acceptability, ease and convenience of administration, flexibility at the time of process scale-up and manufacturing, and availability of advanced packaging technology. However, the oral route becomes a restricted choice in case of delivery of peptides and other sensitive biologicals as well as for drugs that are unstable in the harsh conditions of the upper gastrointestinal (GI) tract or have a poor or erratic absorption through the oral route. It has been reported several decades ago with the discovery of sulfasalazine for the treatment of inflammatory large intestine disease that the large intestine (colon) might serve as a useful alternative site for delivery of drugs and substances that could not otherwise be delivered by the oral route. In a sharp contrast to the acidic and weakly acidic conditions and high enzymatic activity in the upper GI tract, the colon, has near neutral to slightly alkaline pH and relatively low enzymatic activity and hence provides the rational basis for site specific delivery of drugs that are susceptible to stability issues in the upper GI tract. Site specific delivery of drug entities to colon is also advantageous in case of local pathologies of colon like irritable bowel disease and colorectal cancer (Kinget et al. 1998). Various techniques that would prevent drug release in other parts of GI tract and facilitate selective delivery into the colon has been investigated in the last 10-15 years.
The upper GI tract comprises of the stomach and small intestine. The major features of the different regions of the GI tract are presented in Table 1 (Vinarov et al., 2021).
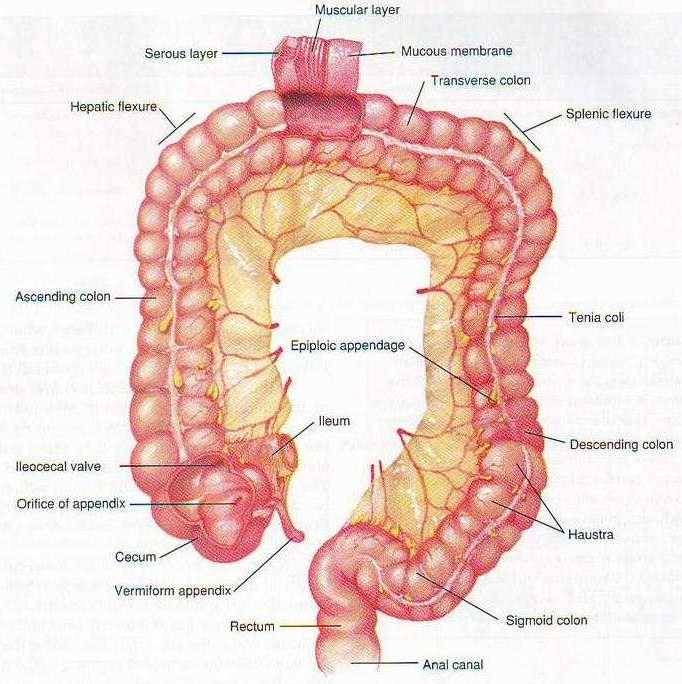
Figure 1. Diagram of the Human GI tract showing various components of Colon
Table 1. Characteristics of the human GI tract (Li et al., 2020)
|
Characteristic |
Stomach |
Duodenum |
Jejunum |
Ileum |
Colon |
|
Length (cm) |
- |
20-30 |
150-250 |
200-350 |
90-150 |
|
pH |
1-3.5 |
5.0-7.0 |
6.0-7.0 |
7.0-7.5 |
5.5-7.0 |
|
Bacterial count (CFU/ml) |
103 |
103 |
103 |
104 |
1011-12 |
|
Normal transit time |
1-2 h |
1 h |
1-2 h |
1-2 h |
10 - 40 h* |
*Highly variable
The two major diseases of colon are inflammatory bowel disease (ulcerative colitis and Crohn’s disease) and colon carcinoma. An understanding of the disease progression, its pathophysiology and alteration in GI conditions due to these diseases is quite essential for successful design of a colon specific drug delivery system (Luo et al., 2019).
A conventional oral dosage form for any ailment of the colon (inflammatory large intestine disease and colon cancer) will result in release of major drug load in stomach and small intestine (the absorption window of most drugs) leading to systemic absorption and drug distribution throughout the body. This would result in non-specific action and systemic accumulation of drug leading to unwanted side effects. A dosage form that can release the drug directly in the colon will result in more effective and localized action, reduced dose, and also reduce systemic drug load and adverse effects resulting from non-specific action. Colon is also attracting interest as a site where poorly absorbed drug molecule may have an improved bioavailability. Additionally, the colon has a longer retention time and appears highly responsive to agents that enhance the absorption of poorly absorbed drugs. For the treatment of diseases like hypertension and asthma, drug release is usually required to be delayed from the time of administration in order to match with the body’s circadian rhythm to maximize efficacy of therapy. In such cases, a delayed release system targeting the colon which shall provide a time lag of 4-6 h is suitable. Further, due to a non-hostile environment (low enzyme (peptidase) activity, near neutral pH), the colon has also been investigated as a site for absorption of protein and peptide drugs that otherwise cannot be given by the oral route (Verkleij et al., 2020).
The colon has been explored as a potential site for delivery of therapeutics for treatment of both local ailments and for diseases that require a time-dependent treatment regimen to match the body’s circadian pattern. Also, the colon has also shown to be a useful site for the delivery of peptides and proteins by the oral route. Colon targeted delivery systems have been developed utilizing a variety of techniques that rely on GI pH, transit times, enterobacteria and luminal pressure for site-specific delivery. With the growing use of NSAIDs in the prophylaxis and chemoprevention of colon carcinoma, the future shall see several colon targeted based formulations entering the market.
Naproxen is first-line therapy for osteoarthritis, acute gouty arthritis, dysmenorrhea, and musculoskeletal inflammation, pain and colon cancer. The oral administration of naproxen has been reported to cause dose dependent systemic and severe local upper gastrointestinal side effects in 35 to 50% patients. Therefore, a formulation of naproxen with negligible to no release in upper gastrointestinal (GI) tract and controlled release in the colonic region would achieve therapeutically effective concentration of drug locally in colon. Thus, apart from maximizing efficacy, it shall also reduce the incidence of GI toxicity and systemic adverse effects associated with the drug (Kolawole and Kashfi, 2022). The main aim of the present project work was to the design, development and characterization of various matrix tablet formulations of naproxen for the potential treatment of colon cancer.
Materials and methods
Materials
Naproxen was obtained as a gift sample from Natco Laboratory, Hyderabad (India); Eudragit (both L100 and S100) were obtained as gift samples from Rohm Pharma, Germany. Ethylcellulose (EC) was purchased from Signet Chem, Mumbai, India. All other chemicals, excipients and solvents used were of either analytical or pharmaceutical grade.
Formulation preparation
The formulation design comprised of single unit matrix based tablet systems (Navarro-Ruíz et al., 2022). The composition of prepared batches is given in Table 2 and 3. Batch quantities of drug and polymer(s) pre-sieved through # 120 mesh (ASTM) and dried at 55°C were mixed. The dry blend was granulated with ethyl alcohol (q.s.) and passed through # 40 mesh and dried at 55°C in a hot air oven. The dried granules were passed through # 60 mesh and the passings blended with 1% w/w talc and 0.5% w/w magnesium stearate and compressed using 7 mm punches on a 16 station rotary tablet compression machine (Cadmach, Ahmedabad, India). Three batches of tablets were prepared for each formulation.
Each tablet comprised of 250 mg of Naproxen. The formulation codes and composition of the prepared colon specific controlled release matrix tablets of Naproxen controlled release colon targeted tablets prepared using combination of various polymer types is given in Table 2 (combination of EL100 and ES100), and Table 3 (combination of EC with EL100 and ES100).
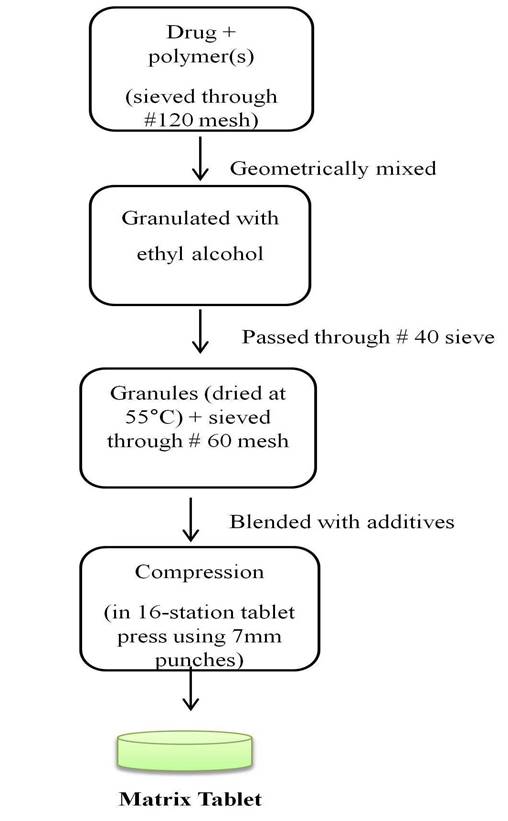
Figure 2. Flowchart For Tablet Manufacturing Process
Table 2. Composition of Naproxen matrix tablets containing combination of EL100 and ES100
|
Formulation code |
EL100 (mg) |
ES100 (mg) |
|
IEL15ES10 |
11.25 |
7.5 |
|
IEL12.5ES12.5 |
9.37 |
9.37 |
|
IEL10ES15 |
7.5 |
11.25 |
|
IEL30ES20 |
22.5 |
15 |
|
IEL25ES25 |
18.75 |
18.75 |
|
IEL20ES30 |
15 |
22.5 |
Each tablet contains 250 mg of Naproxen. Also contains 1% w/w talc and 0.5% w/w magnesium stearate as formulation additives.
Table 3. Composition of Naproxen matrix tablet formulations containing combination of EC with other polymers
|
Formulation code |
EC (mg) |
EL100 (mg) |
ES100 (mg) |
|
(a) EC + EL100 |
|
|
|
|
IEL15EC10 |
11.25 |
7.5 |
- |
|
IEL20EC5 |
15 |
3.75 |
- |
|
IEL30EC20 |
22.5 |
15 |
- |
|
IEL40EC10 |
30 |
7.5 |
- |
|
(b) EC + ES100 |
|
|
|
|
IES15EC10 |
11.25 |
- |
7.5 |
|
IES20EC5 |
15 |
- |
3.75 |
|
IES30EC20 |
22.5 |
- |
15 |
|
IES40EC10 |
30 |
- |
7.5 |
Each tablet contains 250 mg of Naproxen. Also contains 1% w/w talc and 0.5% w/w magnesium stearate as formulation additives.
Physical Characterization of Designed formulations
The designed tablet formulations were studied for their physicochemical properties like weight variation, thickness, crushing strength, friability and drug content uniformity. For estimating weight variation, 20 tablets of each formulation were weighed using a Mettler Toledo balance. The crushing strength of 10 tablets was measured using Monsanto (standard type) tablet crushing strength tester. Friability was determined on 10 tablets in a Campbell Electronic Friabilator for 4 mins at 25 rpm. For estimation of drug content, 10 tablets were crushed and the aliquot of powder equivalent to 10 mg of drug was extracted in methanol: phosphate buffer pH 7.4 (1:9), suitably diluted using phosphate buffer pH 7.4 and analyzed spectrophotometrically at 320 nm.
In vitro release studies of Tablet formulations
In vitro dissolution studies for the tablets were carried out using USP Type II (paddle method) apparatus at 75 rpm at 37 ± 0.5°C. The dissolution was carried out for the first 2 h in distilled water (500 ml). Then, 200 ml of phosphate buffer concentrate (4.75 g of KH2PO4 and 1.07 g of NaOH in distilled water) was added to raise the total media volume to 700 ml and pH to 7.4 for the remaining period. At predetermined time intervals, a 10 ml sample was withdrawn and replaced with fresh dissolution media. The samples were filtered, suitably diluted and analyzed using the UV method discussed earlier (Arévalo-Pérez et al., 2020).
Characterization of release kinetics
In order to understand the mechanism of drug release from these formulations, the cumulative percentage drug release data (post 2 h) was fitted into the power law equation given by Korsemeyer et al. (1983) and Ritger and Peppas (1987)
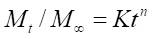 ……. (1)
Where, is percentage of drug released at any time ‘t’; ‘K’ is release rate constant incorporating the structural and geometric characteristics of the polymeric system and the drug and ‘n’ is the diffusion exponent indicative of the release mechanism of the drug. The details of model analysis are presented in Appendix-I.
The t10% (time required for 10% drug release) was determined directly from the plot of cumulative percentage drug released vs. time while the t90% (time required for 90% drug release) was calculated as
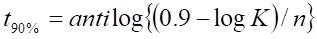 …… (2)
The values of K, n, t10% and t90%, ‘r’ (correlation coefficient of the regression analysis) and MSSR (Mean sum of squared residuals), as obtained from the dissolution data of designed
The release data for formulations in simulated GI fluid pH was compared with the ideal theoretical release profile using dissimilarity (f1) and similarity (f2) factor analysis.
Results and Discussion
Physical characterization of designed tablet based formulations
The prepared tablets from all the batches were found to be of good quality with acceptable physical characteristics. The results of tablet characteristics are present in Table 4 and 5. The crushing strength was found to range between 4.5–5.0 kg across all batches of formulations. The percentage friability and weight variation in all the formulations was £ 0.5% and ± 5.0% respectively. The average drug content across all batches of formulations was within a variation of ± 5% from the theoretical formula value. The low value of weight variation, optimal crushing strength and friability, and high degree of drug content uniformity suggested that wet granulation is an acceptable method of manufacturing matrix embedded formulation of Naproxen for colon specific delivery.
Table 4. Physical characterization of formulations prepared using combination of EL100 and ES100
|
Batches |
Physical Characterization |
||||
|
Drug contenta (mg/ tablet) |
Weight variationb (%) |
Crushing strengthc (kg) |
Friabilityd (NMT %) |
Thicknesse (mm) |
|
|
IEL10ES15 |
73.9 ± 1.2 |
± 1.8 |
4.8 (±0.2) |
0.2 |
1.97 (±0.02) |
|
IEL12.5ES12.5 |
76.6 ± 1.6 |
± 3.3 |
4.8 (±0.1) |
0.2 |
1.96 (±0.04) |
|
IEL15ES10 |
73.4 ± 1.8 |
± 1.9 |
4.8 (±0.2) |
0.5 |
1.99 (±0.02) |
|
IEL20ES30 |
72.2 ± 1.0 |
± 4.0 |
4.9 (±0.1) |
0.2 |
2.09 (±0.02) |
|
IEL25ES25 |
75.3 ± 1.5 |
± 3.6 |
4.8 (±0.1) |
0.1 |
2.07 (±0.01) |
|
IEL30ES20 |
75.3 ± 1.6 |
± 2.8 |
4.6 (±0.3) |
0.2 |
2.06 (±0.01) |
amean ± SD (n = 10); bSD from the mean value (n = 20); c mean ± SD (n = 10); dmean of 10 tablets; emean ± SD (n = 5). The diameter of the tablets was 0.70 ± 0.01 cm.
Table 5. Physical characterization of tablet formulations prepared using combination of EC with other polymers
|
Batches |
Physical Characterization |
||||||
|
Drug content (mg/ tablet)a |
Weight variationb (%) |
Crushing strengthc (kg) |
Friabilityd (NMT %) |
Thicknesse(mm) |
|||
|
(a) EC + EL100 |
|||||||
|
IEL15EC10 |
75.3 ± 1.2 |
±1.2 |
4.6 (±0.2) |
0.1 |
1.95 (±0.03) |
||
|
IEL20EC5 |
73.8 ± 1.3 |
±4.4 |
4.9 (±0.1) |
0.3 |
1.96 (±0.02) |
||
|
IEL30EC20 |
74.1 ± 1.5 |
±1.7 |
4.5 (±0.1) |
0.3 |
2.12 (±0.01) |
||
|
IEL40EC10 |
72.8 ± 1.3 |
±1.5 |
4.8 (±0.1) |
0.2 |
2.11 (±0.04) |
||
|
(b) EC +ES100 |
|||||||
|
IES15EC10 |
74.4 ± 1.5 |
±3.7 |
4.9 (±0.1) |
0.4 |
2.13 (±0.02) |
||
|
IES20EC5 |
76.4 ± 1.4 |
±4.6 |
4.7 (±0.2) |
0.2 |
2.12 (±0.01) |
||
|
IES30EC20 |
72.5 ± 1.4 |
±1.3 |
4.9 (±0.1) |
0.3 |
1.99 (±0.02) |
||
|
IES40EC10 |
72.7 ± 2.1 |
±4.7 |
4.8 (±0.2) |
0.2 |
2.00 (±0.01) |
||
amean ± SD (n = 10); bSD from the mean value (n = 20); cmean ± SD (n = 10); dmean of 10 tablets; emean ± SD (n = 5). The diameter of the tablets was 0.70 ± 0.01 cm.
In vitro release studies
Effect of ethyl cellulose in combination with EL100 or ES100 on Naproxen release
(i) Ethyl cellulose + Eudragit L100
Effect of EC in EL100 was studied at both 25% and 50% w/w level of the polymer. In these formulations the EL100 to EC ratio was varied as 4:1 or 3:2. The release profiles from the matrix tablets containing EL100 and EC in the ratio 3:2 or 4:1 at 25% w/w of drug, i.e., IEL20EC5 and IEL15EC10 and corresponding to 50% w/w of the drug (IEL30EC20 and IEL40EC1) are shown in Fig 3 and Fig 4, respectively. The K values for the formulations IEL20EC5 and IEL15EC10 were obtained as 3.727 h-1.57and 0.355 h-1.89 respectively. It was observed that increasing the relative proportion of EC from 5% to 10% as in the case of (IEL20EC5 or IEL40EC10) and from 10% to 20% (IEL15EC10 or IEL30EC20) retarded the release rate and also extended the total duration of release (Table 6).
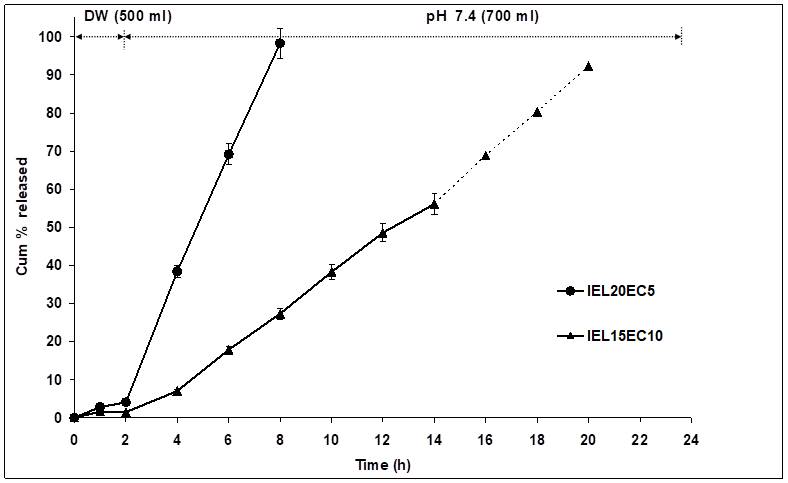
Figure 3. Release profile of matrix tablets of Naproxen containing combination of EL100 and EC in varying ratios at 25% w/w of drug
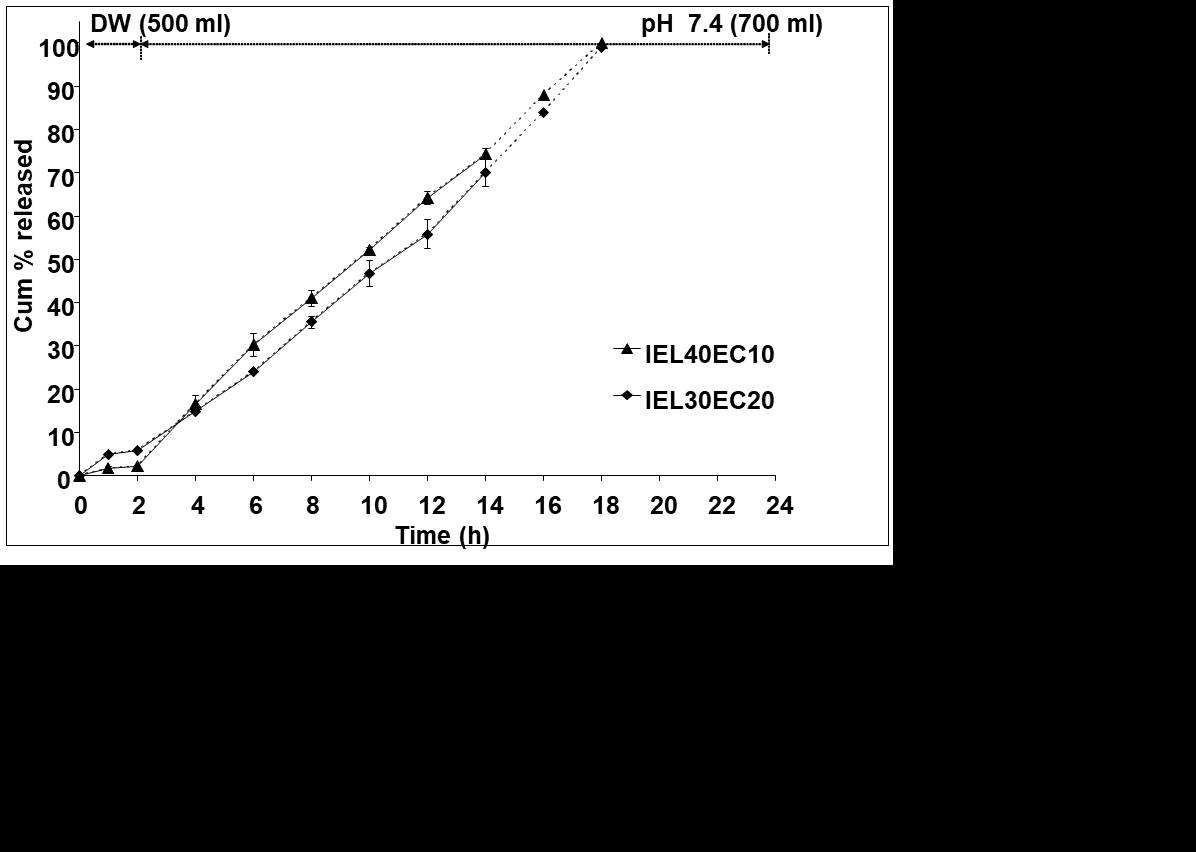
Figure 4. Release profile of matrix tablets of Naproxen containing combination of EL100 and EC in varying ratios at 50%w/w of drug
In case of total polymer proportion at 25% w/w of the drug, t10% increased from 2.3 h for IEL20EC5 to 2.9 h for IEL15EC10 while t90% increased significantly from 7.6 h for IEL20EC5 to 18.5 h for IEL15EC10. At 25% w/w of the drug, the increase in EC percentage from 4:1 to 3:2, resulted in the formation of a tight non-porous matrix allowing for very slow penetration of external media and slower release rates hence significantly extending the duration of release and retarding the release rate (Fig 3). But in case of IEL40EC10 and IEL30EC20, with total polymer proportion of 50% w/w of drug, the t10% increased from 3.0 h for IEL40EC10 to 4.1 h for IEL30EC20 but the t90% value only marginally increased from 16.0 h for IEL40EC10 to 16.8 h for IEL30EC20 (Fig 4). It has been shown in earlier studies that high levels of EC reduce drug release rates on account of formation of a strong matrix with reduced porosity. This increases diffusional path length leading to reduced dissolution media penetration through the micropores resulting in slower drug release. But increasing the total polymer proportion to 50% w/w of drug did not offer any additional advantage in terms of t10% and t90%. The reason for such phenomenon is attributed to the presence of a relatively higher proportion of EL100 in such matrix. As EL100 dissoluted above pH 6.0, the matrix with higher EL100 proportion cannot maintain matrix integrity and tortousity at pH 7.4, increasing the relative proportion of EC in this case was not found to have any impact.
Table 6. Release kinetics characterization of drug release from EL100 and EC matrixtabl ets
|
Batches |
Release kinetics |
||||||||
|
ra |
MSSR |
Kb |
nc |
t10%d |
t90%e |
||||
|
IEL20EC5 |
0.9140 |
4.95 x 10⁻² |
3.727 |
1.57 |
2.3 |
7.6 |
|||
|
IEL15EC10 |
0.9921 |
5.47 x 10⁻⁴ |
0.355 |
1.89 |
2.9 |
18.5 |
|||
|
IEL40EC10 |
0.9690 |
6.38 x 10⁻³ |
1.131 |
1.58 |
3.0 |
16.0 |
|||
|
IEL30EC20 |
0.9995 |
7.49 x 10⁻⁴ |
2.348 |
1.29 |
4.1 |
16.8 |
|||
aCorrelation coefficient; bRelease rate constant; cDiffusional exponent indicative of the release mechanism; d Time for 10% of the drug release (h); e Time for 90% of the drug release (h)
The drug release mechanism for EC + EL100 based matrix tablets was super case II (n > 1), due to matrix erosion implying that the presence of ethyl cellulose did not change the primary mechanism of release that was observed for matrix bases with EL100 alone. It was also observed that sigmoidal release profiles were obtained in all the cases and except for IEL20EC5 that showed slightly higher release rates, all other formulations nearly completed release within 16-18 h, and thereby only slightly deviating from the requirement for complete release in 14-16 h. (ii) Ethyl cellulose + Eudragit S100
The release profiles from the matrix tablets comprising of ES100 and EC (4:1 and 3:2 ratios) at 25% and 50% w/w of drug as shown in Figure 5 and 6, respectively.
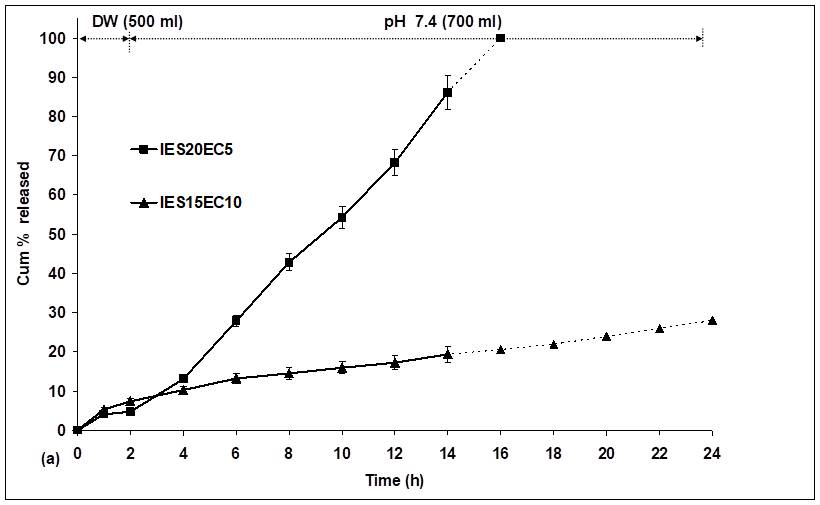
Figure 5. Release profile of matrix tablets of Naproxen containing combination of ES100 and EC in varying ratios at total polymer proportion of 25%w/w of drug
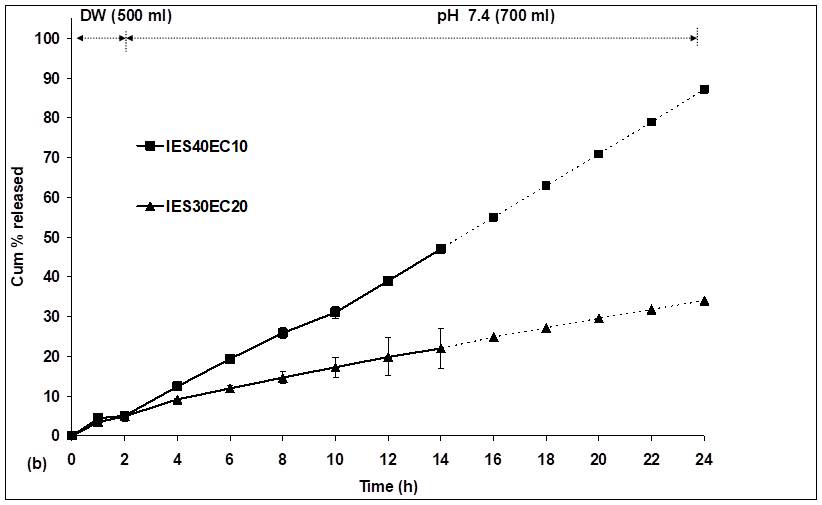
Figure 6. Release profile of matrix tablets of Naproxen containing combination of ES100 and EC in varying ratios at total polymer proportion of 50%w/w of drug
The formulations IES20EC5 and IES15EC10 were marginally different in terms of initial release as is evident from the t10% values (Table 7) for the two formulations (3.4 h and 3.8 h respectively). As the proportion of EC was increased from 5% (4:1) to 10%, the t90% values were drastically increased from 14.8 h for IES20EC5 to 38.5 h for IES15EC10.
From the release profiles of matrices at 50% w/w of drug in similar relative ratios, i.e., IES40EC10 and IES30EC20, the t10% values (Table 7) of 3.4 h for IES40EC10 and 4.2 h for IES30EC20 indicated good retardation in the initial release. However, the t90% values for the two formulations (IES40EC10: 39.6 h, IES30EC20: 28.5 h) were significantly higher than the expected duration of release.
The release mechanism from ES100 matrices in combination with EC was also found to be similar to that observed for EC + EL100 matrices and was super case II release (n > 1.0) indicating erosion of the polymer matrix at higher pH as the primary mechanism of drug release. Except for IES20EC5 with a sigmoidal profile that was within acceptable limits, all other formulations showed significant deviation from the desired target release of 80-90% in 14 -16 h. In comparison to EC + EL100 matrices, the designed matrices of EC + ES100 showed lower rate of drug release at all polymer ratios and proportion due to the nature of ES100 that erodes at pH > 7.0 when compared to the optimal dissolution pH of 6.0 for EL100.
Table 7. Release kinetics characterization of drug release from ES100 and EC based matrix tablets
|
Batches |
Release kinetics |
|||||||
|
ra |
MSSR |
Kb |
nc |
t10%d |
t90%e |
|||
|
IES20EC5 |
0.9980 |
5.30 x 10⁻⁴ |
1.581 |
1.5 |
3.4 |
14.8 |
||
|
IES15EC10 |
0.9976 |
3.08 x 10⁻⁴ |
1.947 |
1.05 |
3.8 |
38.5 |
||
|
IES40EC10 |
0.9850 |
4.54 x 10⁻⁴ |
1.563 |
1.3 |
3.4 |
39.6 |
||
|
IES30EC20 |
0.9976 |
2.97 x 10⁻⁴ |
2.671 |
1.05 |
4.2 |
28.5 |
||
aCorrelation coefficient; bRelease rate constant; cDiffusional exponent indicative of the release mechanism; d Time for 10% of the drug release (h); e Time for 90% of the drug release (h)
Effect of simulated GI fluid pH (without enzymes) on release
From the series of formulations prepared using combination of EL100 and ES100, formulations IEL15ES10 and IEL10ES15, were selected for in vitro release study in simulated GI fluid pH (without enzymes). The in vitro release profiles for these formulations are shown in Figure 7. A slightly greater retardation in release rate was observed when the relative proportion of ES100 in the matrix was increased from 10% to 15% w/w of drug as observed from the t10% values (IEL15ES10: 3.6 h and IEL10ES15:3.8 h) and t90% (IEL15ES10: 14.5 h and IEL10ES15: 15.2 h) (Table 8). The K values for these two formulations were found to be 1.719 h-1.48 and 2.105 h-1.38. This observation was similar to that observed during preliminary studies of formulations carried out in distilled water (500 ml) followed by pH 7.4 medium wherein retardation in Naproxen release from matrices prepared using EL100 and ES100 in combination was found to depend more on the relative proportion of ES100 in the polymer matrix. The decrease in release rate post 2 h is attributed to the presence of lower percentage of carboxylic acid groups on ES100 that get ionized gradually above pH 7.0 leading to slower matrix erosion in the latter case. The drug release mechanism for these two formulations was found to be super case II type implying release by erosion due to dissolution of both Eudragit polymers in matrix. When the in vitro release profiles of these two formulations were compared with the theoretical target release profile, acceptable values of similarity factor f2 (54.8 for IEL15ES10 and 51.8 for IEL10ES15) and dissimilarity factor f1 (7.1 for IEL15ES10 and 5.1 for IEL10ES15) were obtained (Table 8). This implied suitability of the matrix for sigmoidal release profile required for colonic delivery.
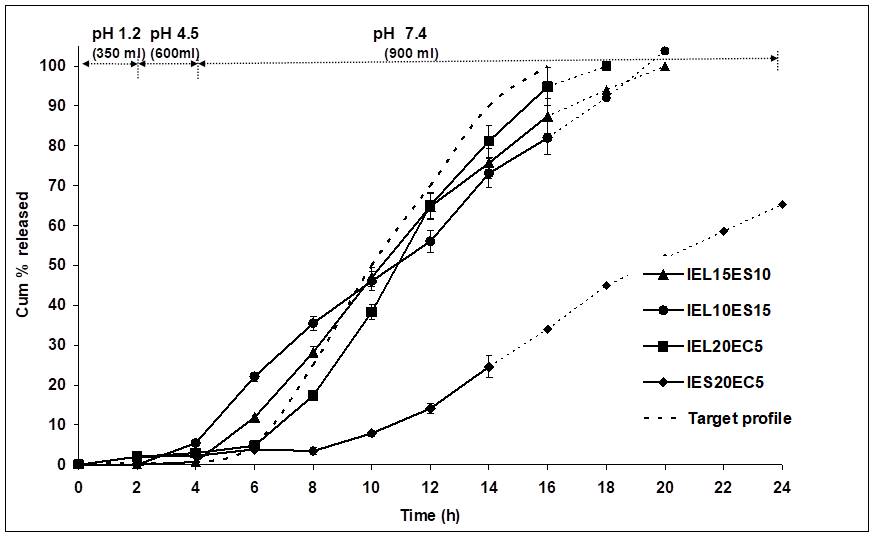
Figure 7. Release profile of Naproxen from EL100 or ES100 based matrix tablets in combination with each other or with EC in simulated GI fluid pH (without enzymes)
For formulation matrix prepared using combination of EC with EL100 or ES100, the in vitro release profiles are shown in Figure . The K values for the two formulations were obtained as 0.522 h-1.99 and 4.657 h-0.91 and the t10% values obtained as 4.9 h for IEL20EC5 and 8.2 h for IES20EC5 respectively, showing a significant difference in the initial release behavior of the drug from the two matrices (Table 8). The combination of EC with ES100 probably resulted in the formation of a highly hydrophobic matrix wherein the pH sensitive polymer was less susceptible to –COOH group ionization which results in erosion of such polymeric matrix in alkaline environment, resulting in very long lag time for drug release. Such a lag time of 8.2 h as observed in the case of IES20EC5 may be beneficial in certain cases when GI transit times are very high or targeting to the remotely terminal part of the colon is desired. However, the calculated t90% values for the two formulations (IEL20EC5: 13.3 h, IES20EC5: 25.9 h) indicated an unacceptable slow release rate for IES20EC5. The n values for the two formulations namely, 1.99 for IEL20EC5 and 0.91 for IES20EC5, indicated differing release mechanisms, signifying an erosion based drug release mechanism for the former and anomalous, non-Fickian (diffusion and polymer relaxation) based mechanism approaching case II (zero order) for the latter. An f2 value of 59.1 and f1 value of 3.9 for the release profile of IEL20EC5 indicated good similarity with the target profile. On the other hand, in case of IES20EC5 a very low f2 value of 1.5 and high f1 value of 69.9 indicated that IES20EC5 was not suitable for colon specific release under present considerations.
Table 8. Release kinetics of selected formulations in simulated GI fluid pH (without enzymes)
|
Formulation series |
Batches |
ra |
MSSR |
Kb |
nc |
t10%d |
t90%e |
f1# |
f2# |
|
EL100 + ES100 |
IEL15ES10 |
0.9799 |
2.21 x 10⁻³ |
1.719 |
1.48 |
3.6 |
14.5 |
7.10 |
54.80 |
|
|
IEL10ES15 |
0.9898 |
1.04 x 10⁻³ |
2.105 |
1.38 |
3.8 |
15.2 |
5.10 |
51.80 |
|
EL100 + EC |
IEL20EC5 |
0.9632 |
1.83 x 10⁻³ |
0.522 |
1.99 |
4.9 |
13.3 |
3.90 |
59.10 |
|
ES100 + EC |
IES20EC5 |
0.9988 |
2.18 x 10⁻³ |
4.657 |
0.91 |
8.2 |
25.9 |
69.90 |
1.50 |
aCorrelation coefficient; b Release rate constant; cDiffusional exponent indicative of the release mechanism; d Time for 10% of the drug release (h); e Time for 90% of the drug release (h). #Release data are compared to the theoretical target release profile. For similarity, f1 should be < 15 and f2 > 50.
Conclusion
In summary, it may be observed that several formulations, viz., IEL15ES10, IEL10ES15 and IEL20EC5 had shown good similarity with the theoretical target release profile in vitro as shown by their similarity factor f2 that was greater than 50 and dissimilarity factor f1 that was less than 15.
Therefore, it could be concluded from the present investigation that presence of either Eudragit L100 or S100 could successfully impart a pH and time dependent sigmoidal release pattern to all hydrophilic and hydrophobic polymer matrix based formulations. The drug release profile from most of the selected formulations in simulated GI fluid (without enzymes) was characterized by an initial lag time period of 4-6 h with low drug release followed by controlled release phase in phosphate buffer media for about 14-16 h. Therefore, these formulations have the potential for pH and time dependent delivery to the colon.
References
Arévalo-Pérez R, Maderuelo C, Lanao JM. 2020. Recent advances in colon drug delivery systems. Journal of Controlled Release. 327:703-24.
Kinget R, Kalala W, Vervoort L, Van den Mooter G. 1998. Colonic drug targeting. Journal of drug targeting. 6(2):129-49.
Kolawole OR, Kashfi K. 2022. NSAIDs and cancer resolution: new paradigms beyond cyclooxygenase. International Journal of Molecular Sciences. 23(3):1432.
Korsmeyer RW, Gurny R, Doelker E, Buri P, Peppas NA. 1983. Mechanisms of potassium chloride release from compressed, hydrophilic, polymeric matrices: effect of entrapped air. Journal of pharmaceutical sciences. 72(10):1189-91.
Li C, Yu W, Wu P, Chen XD. 2020. Current in vitro digestion systems for understanding food digestion in human upper gastrointestinal tract. Trends in Food Science & Technology. 96:114-26.
Luo C, Cen S, Ding G, Wu W. 2019. Mucinous colorectal adenocarcinoma: clinical pathology and treatment options. Cancer communications. 39(1):1-3.
Navarro-Ruíz E, Álvarez-Álvarez C, Peña MÁ, Torrado-Salmerón C, Dahma Z, de la Torre-Iglesias PM. 2022. Multiparticulate systems of meloxicam for colonic administration in cancer or autoimmune diseases. Pharmaceutics. 14(7):1504.
Ritger PL, Peppas NA. 1987. A simple equation for description of solute release II. Fickian and anomalous release from swellable devices. Journal of controlled release. 5(1):37-42.
Verkleij CP, Jhatakia A, Broekmans ME, Frerichs KA, Zweegman S, Mutis T, Bezman NA, van de Donk NW. 2020. Preclinical rationale for targeting the PD-1/PD-L1 axis in combination with a CD38 antibody in multiple myeloma and other CD38-positive malignancies. Cancers. 12(12):3713.
Vinarov Z, Abdallah M, Agundez JA, Allegaert K, Basit AW, Braeckmans M, Ceulemans J, Corsetti M, Griffin BT, Grimm M, Keszthelyi D. 2021. Impact of gastrointestinal tract variability on oral drug absorption and pharmacokinetics: An UNGAP review. European Journal of Pharmaceutical Sciences. 162:105812.


