Rajesh Shukla1, Sunil Singh2*, Jay Ram Patel2, Sarita Kare2, Reenu Yadav2
1Guru Ramdas Khalsa Institute of Science and technology, Barela, Jabalpur, Madhya Pradesh, India
2*Department of Pharmaceutical Chemistry, Oriental College of Pharmacy, Raisen Road Bhopal, Madhya Pradesh, India
*Corresponding author:
Sunil Singh
Oriental College of Pharmacy, Thakral Nagar, Raisen Road,
Bhopal, Madhya Pradesh, India 462021.
Abstract
Objective: A simple, accurate, sensitive and precise Zero order and First order Ultraviolet spectrophotometric method has been developed for the determination of Metformine HCL in bulk dosage form. Materials and methods: The solutions of standard and sample were prepared in methanol. In the UV specrophotometric method, the quantitative determination of the drug was carried for zero order at 234nm and first order at 246nm, the linearity range was found to be 2-12 μg/ml and 2-12 μg/ml respectively. Results: The calibration graphs constructed at their wavelength of determination were found to be linear for zero and first derivative spectrophotometric methods. The proposed methods have been extensively validated statistically that included parameters such as linearity, accuracy, precision, LOD, LOQ, recovery and robustness. There was no significant difference between the performance of the proposed method regarding the mean values and standard deviations. Conclusion: The described methods can be readily utilized for analysis of pharmaceutical formulation.
Keywords: Method development; Validation; Derivative Spectroscopy; Metformin HCL
Introduction
Metformin hydrochloride (Dunn and Peters 1995) (Fig.1) (N, N-dimethylimidodicarbonimidicdiamide hydrochloride) is a biguanide prescribed for the treatment of type II diabetes mellitus (Setter et al., 2003) and is the drug of choice in obese patients (Susan and Jack, 2014). It increases glucose transport across the cell membrane in skeletal muscles (Arayne et al., 2009) and it can inhibit the formation of advanced glycosylation end-products (Ruggiero-Lopez et al., 199).
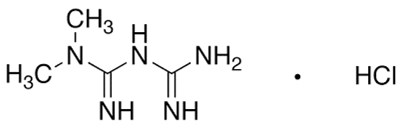
Figure1: Structure of Metformin HCL
Pharmaceutical research is developing increasingly complex molecules and drug formulations, and each novel and highly selective analytical technique is therefore of much potential interest. Literature is enriched with several analytical methods for determination of Metformin HCL in single and in other combinations in different solvents (Arayne and et al., 2009, Amruta et al., 2012). A comparison of the results obtained by simple and first order derivative absorption specrophotometric in the ultraviolet region and obtained by HPLC (Chhetri et al., 2014) and other instrumental methods of qualitative and quantitative analysis of drugs reveals that simple and first order derivative specrophotometric determinations can be an economically advantageous alternative in many cases (Jani et al., 2015). Methods were validated as per the ICH guideline (ICH guideline., 2003). So, in the present investigation, simple and first order derivative specrophotometric determination of Norfloxacin in tablet dosage form is reported.
Materials and methods
Instrumentation
Analysis carried out on Lab India UV-3200 UV-VIS spectrophotometer, a double beam high speed scanning spectrophotometer (200-800 nm) with a photomultiplier tube detector and having variable spectral bandwidth (0.5-5.0 nm).
Chemicals and reagents
Metformin HCL was received as gratis sample by Aurobindo Pharma Ltd, Hyderabad. All chemicals used were of analytical grade (E. Merck, India).
Method 1: Development of Zero order spectroscopic method
Standard stock solution
To prepare stock solution of Metformin HCL (MTN) (1000 μg/ml), 100 mg of MTN was placed in 100 ml volumetric flask and dissolved in 75 ml of methanol and the volume was made up to the mark with methanol. 10 ml of the solution was diluted up to 100 ml with methanol to produce final stock solution of 100 μg/ml of MTN.
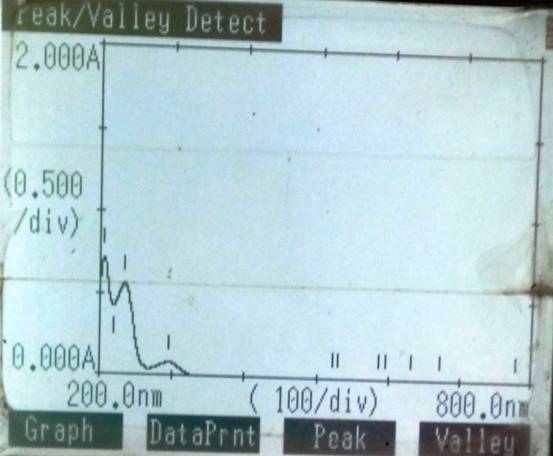 Figure 2 Overlain spectra of Metformin HCL
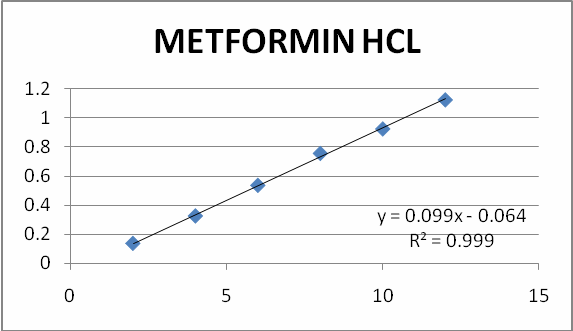
Figure 3 Calibration curve for Metformin HCL
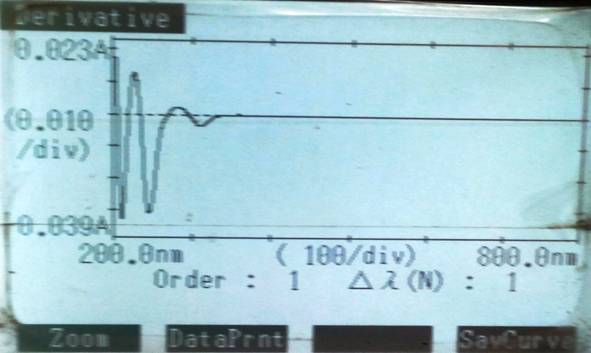
Figure 4 Derivative spectra for Metformin HCL
Sample preparation
Twenty tablets (METIF-500) were taken, powdered and powder weight equivalent to 500 mg of metformine HCL was accurately taken and transferred to a 50 ml of volumetric flask. Twenty ml of methanol added to the same and sonicated for 30 min. The flask was shaken, and the volume was diluted to the mark with the same mixture. The above solution was filtered using whatman filter paper no. 1. Appropriate volume of the aliquot was transferred to a 50 ml volumetric flask and the volume was made up to the mark with methanol. The spectra were recorded and then measured at 234 nm for MTN. The overlain spectra and calibration curve are shown in Figure 2 & 3.
Method 2: Development of first order derivative method
Standard stock solution
To prepare stock solution of MTN (1000 μg/ml), 100 mg of MTN was placed in 100 ml volumetric flask and dissolved in 75 ml of methanol and the volume was made up to the mark with methanol. 10 ml of the solution was diluted up to 100 ml with methanol to produce final stock solution of 100 μg/ml of MTN.
Sample preparation
Twenty tablets (MET SR-1000) were taken and powdered then powder weight equivalent to 1000 mg of metformin was accurately taken and transferred to a 50 ml of volumetric flask. Twenty ml of methanol added to the same and sonicated for 30 min. The flask was shaken, and the volume was diluted to the mark with the same mixture. The above solution was filtered using whatman filter paper no. 1. Appropriate volume of the aliquot was transferred to a 50 ml volumetric flask and the volume was made up to the mark with methanol. The first derivative spectra were recorded and then measured at 246 nm for MTN. The overlain spectra and calibration curve are shown in Figure 4.
Linearity
Different aliquots were pipette out from standard stock solution into a series of 10 ml volumetric flasks and the volume was made up to the mark with methanol to get concentrations of 2, 4, 6, 8, 10, and 12 μg/ml of metformin. The solutions were scanned on spectrophotometer (Lab India-3200) in the UV range 200-400 nm. The linearity was found 0.999 and range was found 2-12 μg/ml for both methods.
Recovery studies
To the preanalyzed sample solutions (10 μg/ml of Metformin HCL), a known amount of standard stock solution were added at different levels i.e. 80, 100 and 120%. The solutions were reanalyzed by proposed method.
Precision
Precision is determined by intra-day and interday precision. Intra-day precision was determined by analyzing the 6, 8 and 10 μg/ml of drug solution for three times in the same day for both proposed methods. Inter-day precision was determined by analyzing the 6, 8 and 10 μg/ml of drug solutions daily for over the period of a week for both proposed methods.
Repeatability
Repeatability was determined by analyzing 10 μg/ml concentration of drug solution for six times.
Limit of Detection and Limit of Quantitation
Several approaches for determining the detection limit and quantitation limit are possible, depending on whether the procedure is a non-instrumental or instrumental.
Ruggedness
Ruggedness of the proposed method is determined by analysis of aliquots from homogenous slot by two analyst using same operational and environmental conditions.
Results and discussion
The method was validated according to International Conference on Harmonization (ICH guideline, 2003). Q2B absolute guidelines for validation of analytical method for the determination of linearity, sensitivity, precision and accuracy. Precision of the method was determined by adding known amounts of pure drug (80, 100 and 120%) in triplicate. In UV spectroscopic method, the zero and first order spectra were utilized for developing the equations for analysis. Metformin HCL showed maximum absorbance at 234 nm and 246 nm for zero and first order derivative spectroscopy respectively. The normal spectra were derivatized into first order derivative, using UV software of instrument, where Δλ = 2. The amplitudes of the corresponding troughs were measured at 246 nm (Table 1). The percentage recovery value obtained within standard limit of 99.43% to 101.2 % for both methods which confirmed that the methods were accurate and free from any interference of excipients (Table 2). The low value of standard deviation obtained indicated precision of the method. Results of intraday and interday precision studies are reported in Table 3. The reproducibility, repeatability (Table 4) and ruggedness (Table 5) of proposed methods were found to be satisfactory which was evidenced by low values of standard deviation, LOD and LOQ (Table 6) for both methods were found to be satisfactory.
Table 1. Linearity study of Metformin HCL
|
Sr. No. |
Concentration |
Method 1 |
Method 2 |
||
|
|
μg/ml |
Amplitude (Mean ± SD) |
% RSD |
Amplitude (Mean ± SD) |
% RSD |
|
1 |
2 |
0.1869±0.023 |
0.98 |
0.132±0.12 |
1.02 |
|
2 |
4 |
0.4674±0.012 |
0.87 |
0.321±0.31 |
1.13 |
|
3 |
6 |
0.7121±0.041 |
1.02 |
0.523±0.02 |
0.97 |
|
4 |
8 |
0.9946±0.033 |
0.99 |
0.843±0.06 |
0.99 |
|
5 |
10 |
1.3131±0.021 |
1.21 |
1.132±0.21 |
1.03 |
|
6 |
12 |
1.5359±0.015 |
1.09 |
1.421±0.07 |
1.09 |
Table 2. Results of recovery studies
|
Pre-analysed sample solution (μg/ml) |
Method 1 |
Method 2 |
||
|
% Amount of drug added (μg/ml) (n=3) |
% Recovery |
% Amount of drug added (μg/ml) (n=3) |
% Recovery |
|
|
8 |
80% |
99.21±0.32 |
80% |
101.02±0.48 |
|
100% |
98.96±0.41 |
100% |
99.97±0.21 |
|
|
120% |
100.24±0.34 |
120% |
100.02±0.14 |
|
Table 3. Results of precision studies (Intra-day and Inter-day)
|
Component |
Conc. μg/ml |
Method 1 |
Method 2 |
||||||
|
Intra-day precision |
Inter-day precision |
Intra-day precision |
Inter-day precision |
||||||
|
Conc. found (n=3) |
RSD |
Conc. found (n=3) |
RSD |
Conc. found (n=3) |
RSD |
Conc. found (n=3) |
RSD |
||
|
Metformin HCL |
6 |
5.9±0.53 |
1.02 |
6.03±0.23 |
0.95 |
5.7±0.51 |
1.21 |
5.8±0.24 |
1.21 |
|
8 |
7.4±0.42 |
0.98 |
7.65±0.31 |
0.89 |
8.04±0.41 |
1.04 |
8.7±0.61 |
0.98 |
|
|
10 |
9.6±0.46 |
1.05 |
9.96±0.54 |
0.93 |
9.73±0.52 |
0.99 |
9.8±0.57 |
0.95 |
|
Table 4. Results of repeatability studies
|
Component |
Method 1 |
Method 2 |
||||
|
Amount taken (μg/ml) (n=6) |
Amount found (%) |
RSD
|
Amount taken (μg/ml) (n=6) |
Amount found (%) |
RSD
|
|
|
Metformin HCL |
10 |
99.55 ± 0.87 |
1.32 |
10 |
99.86 ± 0.75 |
1.47 |
|
Component |
Label claim (mg) |
Method 1 Amount Found (%) (n=5) |
Method 2 Amount Found (%) (n=5) |
||
|
Analyst I |
Analyst II |
Analyst I |
Analyst II |
||
|
Metformin HCL |
400 |
101.14 ± 0.65 |
99.33 ± 0.87 |
98.99 ± 0.64 |
100.33 ± 0.47 |
Table 6. Results of LOD and LOQ
|
Component |
Method 1 |
Method 2 |
||
|
LOD |
LOQ |
LOD |
LOQ |
|
|
Metformin HCL |
0.46 |
1.87 |
0.32 |
1.44 |
Present study showed the applicability of multivariate linear regression move towards to the UV data obtained at different wavelengths for the calibration and tablet analysis. Statistically, the use of vast number of data calculated for a sample analysis makes the results satisfactory. Notion at the back that effort was diminish the uncertain hindrances caused during the analysis. The data obtained for the estimation of metformin in bulk and marketed formulation proved the high level accuracy and precision after calibration.
Conclusion
The developed method which incorporates a change in the solvent used in the methods for the initial dilution of the tablet samples would lead to accurate quantification of metformin HCl. The developed method was successfully validated and should be used for the assay of metformin hydrochloride in metformin HCl tablets. Percent recovery and resulted concentration of active ingredient in formulations showed that the amount of drug present is reliable with the label claim. Hence, this method is very useful with very mathematical contents, is more consistent than the other spectrophotometric methods and strongly recommends the application in calibration models for a routine analysis.
References
Amruta B, Minal R, Ghante, S D Sawant. 2012. Simultaneous UV spectrophotometric method for estimation of sitagliptin phosphate and metformin hydrochloride in bulk and tablet dosage form Scholars Research Library, Der Pharma Chemica, 4 (3): 854-859.
Arayne MS, Sultana N, Zuberi MH, Siddiqui FA. 2009. Spectrophotometric quantitation of metformin in bulk drug and pharmaceuticalformulations using multivariate technique. Indian Journal of Pharmaceutical Science, 71(3): 331–335.
Chhetri HP, Thapa P, Schepdael AV. 2014. Simple HPLC-UV method for the quantification of metformin in human plasma with one step protein precipitation. Saudi Pharmaceutical Journal, 22 (5), 483–487.
Dunn CJ, Peters DH. 1995. The biguanide metformin (dimethylbiguanide) is an oral antihyperglycaemic agent used in the management of non-insulin-dependent diabetes mellitus (NIDDM). Drugs, 49 (5): 721–49
ICH guideline, 2003. Stability Testing of New Drug Substances and Products Q1A (R2), International Conference on Harmonization, IFPMA, Geneva.
Jani BR, Shah KV, Kapupara P. 2015. Development and validation of UV Spectroscopic method for simultaneous estimation of Dapagliflozin and Metformin. International Journal of Research and Development in Pharmacy and Life Sciences, 4(3):1569-1576.
Ruggiero-Lopez D, Lecomte M, Moinet G, Patereau G, Lagarde M, Wiernsperger N. 1999. Reaction of metformin with dicarbonyl compounds. Possible implication in the inhibition of advanced glycation end product formation. Biochemistry and Pharmacology 1, 58(11): 1765-73.
Setter SM, Iltz JL, Thams J, Campbell RK. 2003. Metformin hydrochloride in the treatment of type 2 diabetes mellitus: a clinical review with a focus on dual therapy. Clinical Therapeutics 25(12): 2991-3026.
Susan ZY, Jack AY. 2014. Long-term Drug Treatment for Obesity: A Systematic and Clinical Review. JAMA 1, 311(1): 74–86.


