Sateesha S.B.1*, Hirday Narayan Sah1, Rajamma A.J.2
1Department of Pharmaceutics, Acharya & BM Reddy College of Pharmacy, Bengaluru 560107, Karnataka, India
2Department of Pharmacognosy, KLE College of Pharmacy, Bengaluru 560010, Karnataka, India
*Address for Corresponding Author
Dr. Sateesha SB
Department of Pharmaceutics
Acharya & BM Reddy College of Pharmacy, Bengaluru-5600107 Karnataka, India
Abstract
Objective: The objective of the present study was to develop the liposomes of “ferrous ascorbate” as novel formulation of Iron supplement. Material and methods: The Liposomes of ferrous ascorbate was developed by thin film hydration technique. Soya lecithin and cholesterol were used to formulate iron liposome. Iron entrapped liposomes were freeze dried to improve their stability. Compatibility of ferrous ascorbate with lipid materials of the formulation was confirmed by FTIR studies. Formulations were characterized for vesicular size, zeta potential, entrapment efficiency, drug loading efficiency and drug release characteristics. Results: Formulation were found to be monodisperse and highly stable as evidenced by scanning electron microscopy (SEM) and zeta potential measurement. The vesicular size and zeta potential of all the formulations were within the range of 271 to 365nm and -35 to -48 mV respectively. Entrapment efficiency of ferrous ascorbate was found to be 63% w/w to 69% w/w respectively. The total iron content in optimized formulation estimated by atomic absorption spectroscopy was found to be 6.5μg/ml. Drug release pattern was measured using dialysis method and it was found to be steady and sustained for the period of 8h. The formulation was found to be stable during three months under the conditions of 40±2°C/ 75±5% RH. Conclusion: We conclude that the developed iron entrapped liposome can be used as iron supplement to rectify the iron deficiency anemia.
Keywords: Reconstitutable nanoliposome, iron deficiency anemia, liposome of ferrous ascorbate, lyophilized liposome
Introduction
Iron deficiency anemia is the most common micronutrient deficiency in the world today, affecting more than 2 billion people globally (Scott et al., 2014). Iron deficiency anemia is most prevalent and severe in young children (6-24months) and women of reproductive age (Pisoni et al., 2015). Also, the iron deficiency is often found in older children, adolescents and in adult men. It impacts the lives of millions of women and children contributing to poor cognitive development, increased maternal mortality and decreased work capacity (Yuan et al., 2013). The development of iron deficiency is the consequence of an interaction of 3 distinct risk factors: increased host requirements, increased blood loss and limited supply or impaired absorption of iron by the conventional preparations. In addition to poor nutrition, parasitic and bacterial infections can contribute to depletion of iron (Carretero et al., 2008). The methods that are commonly used to control the micronutrient malnutrition today are use of traditional methods of Iron supplements as capsules, tablets, chewable tablets, and liquids. But the iron when given in conventional form needs an active transport process in the blood stream to move across any cellular membrane. Much of the iron that is not actively transported into the cells will be filtered out by the kidneys and passed in the urine. Also, iron supplements in conventional form produce stomach cramps, nausea, and diarrhea in some people (Carretero et al., 2008).
Poor absorption and low bioavailability of iron can be rectified with liposome encapsulation (Gautam et al., 2008; Miller LJet al., 2013). Liposome encapsulation overcomes the absorption barriers and cellular uptake restrictions, because liposome does not rely on any carrier transport system. Instead, due to their size and composition, they are able to passively absorb through the intestinal wall and through cellular membranes. As a result, liposome-encapsulated nutrients achieve maximum bioavailability in the cells, where they are needed most (Popovska et al., 2013).
This research demonstrates that iron encapsulated liposome as a new form of iron supplement with high efficiency of absorption and low side effects compared with the traditional iron supplements. The present investigation uses ferrous ascorbate as source of iron and encapsulated in liposomes. The liposomes were freeze dried to enhance their stability. The dry liposome was developed such that the formulation should be able to produce progressive release of iron for prolonged period of time for better absorption.
Materials and methods
Phosphatidylcholine, cholesterol, poloxamer -407, polaxamer-188, glyceryl monooleate were purchased from Yarrow Chem Products, India. Ferrous ascorbate and ferrous sulphate were purchased from Sigma Aldrich ltd. All other solvents and reagents used in the research were of analytical grade.
Standard curve of ferrous ascorbate by UV-Visible spectroscopy
Weighed amount of 100 mg of ferrous ascorbate was dissolved in 100 ml of 0.1N HCl. The solution is further diluted with0.1N HCl to get 10, 20, 30, 40, 50, 60, 70, 80 and 90µg/ml of ferrous ascorbate aliquots. The drug solution was scanned between 200 to 600 nm using UV-Visible spectrophotometer (UV-Spectrophotometer, Agilent) to determine the λmax of ferrous ascorbate as 242 nm (Figure 1a). Calibration curve was plotted as concentration versus absorbance using the above results (Figure 1b). The slope of the calibration curve was 0.024 with the regression coefficient (R2 = 0.997) which indicated good linearity. Thus, the calibration curve obeys Beer’s law at the given concentration range of 10-90 µg/ml at 243 nm. The slope of the calibration curve was used for the quantitative determination of ferrous ascorbate in the formulated liposome.
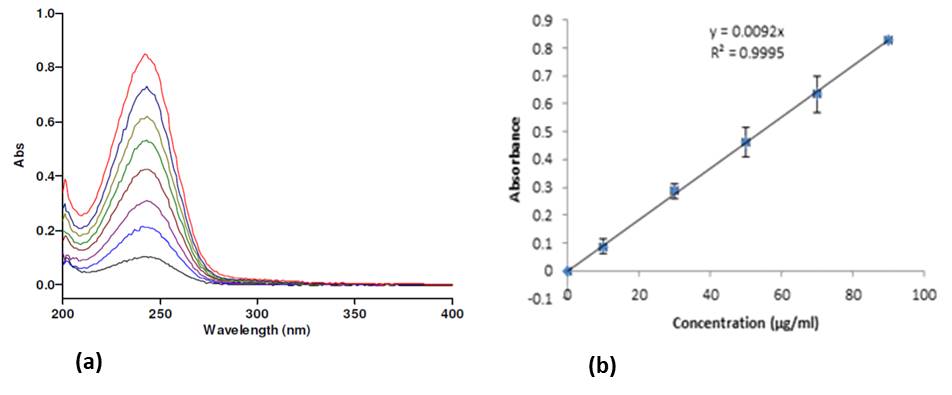
Figure 1. (a) λmax of ferrous ascorbate, and (b) Standard curve of ferrous ascorbate by UV spectroscopy
Standard curve of ferrous sulphate by atomic absorption spectroscopy
Atomic absorption spectroscopy was used to quantify the total iron content in the liposome (Tinsley et al., 2022). An accurate amount of 50 mg of ferrous sulphate was dissolved in 100 ml of HPLC water. The metal ion solution is sufficiently diluted to get a concentration range of 1-5µg/ml. The solutions were scanned using atomic absorption spectroscopy (ASS), Thermo electron corporation, GF95Z, German furnace, at 243 nm to construct the standard curve as concentration versus absorbance (Figure 2). The slope of the curve was Y = 0.024x-0.0006 and r2 = 0.9971 and is used to quantify the total iron content in liposome.
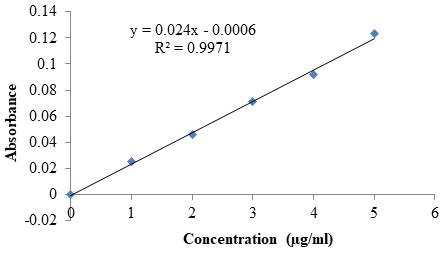
Figure 2. Standard plot of ferrous ascorbate by AAS method
Drug- excipients compatibility study by FTIR
Compatibility of the ferrous ascorbate with the formulation ingredientswas checked byFTIR studies. The pure drug and the physical mixture of drug and excipients at the ratio of 1:1 was scanned on the FTIR spectroscopy at the wave number of 400-4000 cm-1. The spectra of the pure drug and the spectra of drug-excipient mixture arecompared with the standard FTIR range of the ferrous ascorbate (Burguera et al., 1984).
Preparation of ferrous ascorbate liposomes
A batch size of 200ml of ferrous ascorbate encapsulated liposome was prepared by thin film hydration method (Dua JS et al., 2012). A specified quantity (Table2) of phosphatidylcholine (lecithin), cholesterol and chloroform were taken in a 500 ml capacity round bottomed flask (RBF). The flask was continuously vortexed on water bath maintained at 60°C until the chloroform is completely evaporated resulting in thin film formation on the inner walls of flask. On the other side, the ferrous ascorbatesolution in phosphate buffer (PBS) pH 5.8 was prepared. This drug solution was dispersed in to thin film of lipids in the flask by sonicationon a bath sonicator at 60°C. The flask is agitated till the film is completely transformed to uniform vesicles. Finally, the prepared liposomes were lyophilized (Labconco, Mo, USA) at -80°C overnight and stored for future studies (Michelland et al., 1984).
Table 1. Formulation chart of ferrous ascorbate liposomes
|
Ingredients |
F1 |
F2 |
F3 |
F4 |
F5 |
F6 |
F7 |
F8 |
F9 |
|
Ferrous ascorbate (mg) |
25 |
25 |
25 |
50 |
50 |
50 |
75 |
75 |
75 |
|
Lecithin (mg) |
321.94 |
482.91 |
321.94 |
321.94 |
482.91 |
321.94 |
321.94 |
482.91 |
321.94 |
|
Cholesterol (mg) |
193.33 |
193.33 |
298.99 |
193.33 |
193.33 |
298.99 |
193.33 |
193.33 |
298.99 |
|
Chloroform (ml) |
40 |
40 |
40 |
40 |
40 |
40 |
40 |
40 |
40 |
|
phosphate buffer (pH 5.8) (ml) |
20 |
20 |
20 |
20 |
20 |
20 |
20 |
20 |
20 |
Entrapment efficiency
Ferrous ascorbate entrapped liposome was subjected to centrifuged at 9000 rpm for 60 min at 4°C to isolate the free drug (unentrapped drug) from the liposomes. The supernatant was collected and the concentration of free drug is measured by UV-Visible spectrophotometer at 242 nm. The sediment was collected separately and dispersed in to the methanol in a glass vial. The methanolic mixture is shaken for 5 min and centrifuged at 13000 rpm. The supernatant was collected and subjected for measurement of entrapped drug at 242 nm (Yang et al., 2014).
In addition, the total amount of ferrous ascorbate in liposomes was measured by dissolving the liposome in equal volume of methanol. The mixture is centrifuged at 13000 rpm and the supernatant was separated. The drug content (total amount) in the supernatant was measured using UV-Visible spectrophotometer at 242 nm.
The amount of drug entrapped is obtained using the formula:
Amount of entrapped drug = Total amount of drug – Unentrapped drug
Entrapment efficiency (EE) was calculated using formula:
% EE = (Amount of drug entrapped/ Amount of drug added)*100
In vitro release study
In vitro drug release study was carried out using conventional dialysis technique (Savolainen et al., 1997). Theferrous ascorbate loaded liposomes was placed in a dialysis bag. The dialysis bag was immersed in a beaker containing 250 ml of phosphate buffer (pH 6.8) containing receptor fluid. The whole solution was stirred at 50rpm on thermostat controlled magnetic stirrer. Sink condition was established throughout the study period and the temperature was maintained to 37±0.5°C. The continuous phase was sampled periodically at definite time interval and the drug diffused was analyzed using UV- Visible spectrophotometer at 242 nm.
Particle size characterization
Zeta potential (or electrophoretic mobility), dimensional specifications and polydispersity index of vesicles was determined using Malvern Zetasizer Nano-ZS90 by dynamic light scattering mechanism (Honary et al., 2013). About 1.5 ml of the sample in a special cuvette which consists of an electrode was used to measure the zeta potential and size distribution of the vesicles.
Polydispersity index was calculated from the following equation,
PDI =Mw -Mn
‘Mw’ is the average molecular weight
‘Mn’ is the average number
‘Mn’ is more sensitive to molecules of low molecular mass, while ‘Mw’ is more sensitive to molecules of high molecular mass.
Surface morphology of liposomes
The SEM photographs were used for morphological characterization of liquid liposomes and dry liposomes (Panel et al., 2011). The liquid and freeze dried ferrous ascorbate liposome was scanned using scanning electron microscope (ZEISS model number: ULTRA 55 Field emission scanning electron USA, Indian Institute of Science, Bengaluru) at specified magnification (50.00 KX, 4.09 KX) at room temperature.
Ferrous concentration in liposome
The atomic absorption spectroscopy method was used to determine the concentration of metal ion in the optimized liposome formulation (F8) (Greici et al., 2017). An accurate weight of 100 mg of dry liposomes (F8) was dissolved in 100 ml of methanol and filtered. About, 1 ml of the filtrate was taken and diluted to 10 ml with HPLC water and the sample was analyzed for ferrous concentration by AAS. The concentration of ferrous in F8 was determined to be 6.5μg/ml (6.5ppm).
Stability of liposome formulation
The stability studies were conducted for the optimized formulation (F8).A known weight of dry liposomes equivalent to 75 mg ferrous ascorbate were filled in the capsule. The capsule was packed in aluminum foil and kept in stability chamber (Thermo lab, scientific, Mumbai) maintained at 40±2°C/ 75±5% RH for three months. Sample was analyzed at the interval of 30 days to know any changes in the drug content and hence the stability of the formulation (Kumar et al., 2010).
Statistical analysis
The results are average of three determination ± standard deviation. Regression coefficient (r2) was taken to consideration for calibration curve.
Results and Discussion
Preparation of liposome formulation
Preparation of liposome by thin film hydration method involves removal of organic solvent to get a thin film of lipid. The thin film produced was hydrated with aqueous drug solution. The thickness and uniformity of film depends upon the rotational speed of the flask. A speed of 100 rpm was found to be optimum and yield a uniform thin film which forms spherical vesicles upon hydration. Below and above the 100rpm of rotational speed produced thick films that resulting in aggregates of vesicles upon hydration. The volume of hydration medium plays a vital role in producing stable liposome. The increase and decrease in the volume of hydration medium has direct influence on the drug encapsulation, drug leakage and aggregation of vesicles. Further, the duration of hydration of thin film is also important for the development of uniform sized liposomes. Therefore, the hydration time was limited to 20-45 min for the batch size of 200 ml. Any deviation from this optimal hydration time resulted in a decreased drug entrapment.
Drug- excipients compatibility study by FTIR
Drug-polymer interactions play a vital role with respect to biological performance and formulation stability. FTIR spectroscopy was used to check the interaction between drug and the polymers of the formulation. FTIR spectra and the spectral data were shown in Figure 3 and Table 1. The frequency and intensity of peaks were within the standard range of ferrous ascorbate. This reveals that there was no chemical interaction between the drug and excipients and does not have any kind of physical or chemical modifications of the drug (Grit et al., 1993). Therefore, the method of preparation and formulation composition is reliable, accurate and satisfactory.
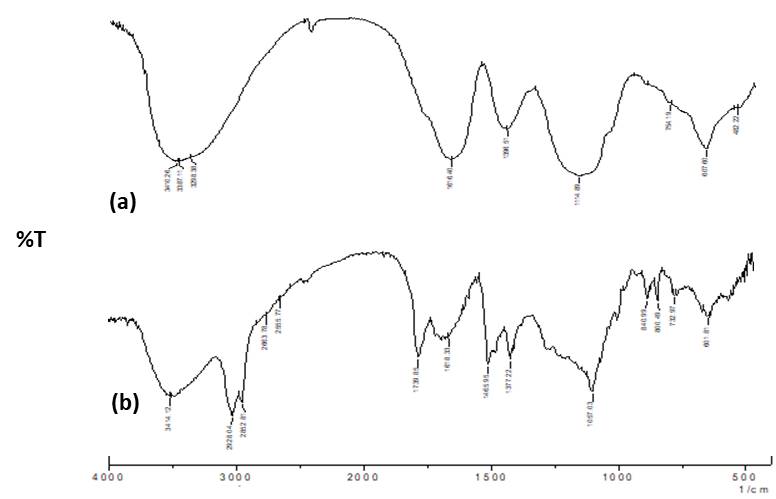
Figure 3. FTIR spectrum of: a) ferrous ascorbate, and b) mixture of ferrous ascorbate, lecithin and cholesterol
Table 2. FTIR data for ferrous ascorbate and its mixture with formulation ingredients
|
Vibrations |
-C=C-stretch |
C-O-C stretch |
-OH stretch |
-CH stretch |
-NH stretch |
-C=O stretch |
|
Standard wave number range for Ferrous ascorbate |
1600-1475 |
1300-1000 |
3500-3200 |
3000-2850 |
3500-3300 |
1725-1700 |
|
Wave number range of Ferrous ascorbate used in the study |
1616.4 |
1114.89 |
3410.28 |
2852 |
- |
- |
|
Ferrous ascorbate +lecithin + cholesterol (1:1:1) |
1618.33 |
1057.03 |
3414.12 |
2852.81 |
- |
- |
Characterization of liposomes
Drug content estimation
Drug content was in the range of 28.6±0.10 to 31.70±0.16 % for the formulation F7 to F9. Result is shown in Table 3. The drug content was higher for the formulation F8 and lower for formulation F7. Therefore, the formulation F8 was considered as the best and is used as optimized for further studies.
Drug entrapment efficiency
Percentage entrapment efficiency (EE) is a critical parameter which must be optimized while developing a drug delivery system. The ability to entrap a sufficient amount of drug is one of the most desirable properties for liposome. Percentage entrapment efficiency of all liposome formulations (F1-F9) is in the range of 50.42 to 62.92%. The % EE was found to be higher for F8 and the result is shown in Table 3. The %EE is noticeably increases with increase in the amount of drug used, and decrease in the quantity of cholesterol used (Chien et al., 1992). The effect of phosphatidyl choline concentration and rotational speed on the entrapment efficiency of the drug was not significant. Amongst, the formulation F8 is shown the best results for practical yield, drug content and drug entrapment.
Zeta potential and particle size characterization
Particle size of an iron encapsulated liposome is an essential parameter that indicates both invitro and in vivo biological efficacy. Generally, the smaller particles can readily pass through the intestinal wall from leaky vasculature and could reach the systemic (Anjali and Kaushil, 2016). The polydispersity index of the liposomes prepared under optimal synthesis conditions, were 0.36 to 0.43. These results suggest the propensity of the synthesized liposome to be absorbed to systemic circulation. Further, the zeta potential of the vesicle being in the range -32 to -0.34 mV, indicating their stability. Zeta potential and PDI results of the formulation F7, F8, and F9 are shown in Figure 5 and Table 4.
Table 3. Entrapment efficiency of ferrous ascorbate in liquid liposomes
|
Formulation |
Amount of drug used (mg) ± SD* |
Total drug content (mg) ± SD* |
Amount of drug unentrapped (mg) ± SD* |
Amount of drug entrapped (mg) ± SD* |
Entrapment efficiency (% EE) |
|
F1 |
25 |
22.35±0.15 |
6.29±0.03 |
12.60± 0.08 |
50.42 |
|
F2 |
25 |
23.26±0.12 |
6.03±0.03 |
14.41± 0.06 |
57.65 |
|
F3 |
25 |
21.12±0.10 |
5.91±0.06 |
13.43± 0.10 |
53.72 |
|
F4 |
50 |
44.58±0.57 |
14.86±0.17 |
28.34±0.12 |
56.67 |
|
F5 |
50 |
42.84±0.28 |
13.14±0.02 |
29.07±0.16 |
58.14 |
|
F6 |
50 |
43.78±0.66 |
16.01±0.20 |
26.16±0.68 |
52.32 |
|
F7 |
75 |
68.65±0.41 |
23.36±0.04 |
45.62±0.32 |
60.82 |
|
F8 |
75 |
70.01±0.21 |
25.74±0.21 |
47.19±0.26 |
62.92 |
|
F9 |
75 |
71.34±0.62 |
26.42±0.23 |
45.51±0.45 |
60.68 |
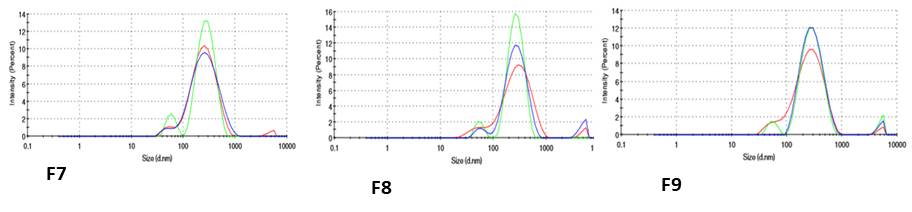
Figure 4. Vesicles size and size intensity of ferrous ascorbate liposome F7, F8 and F9
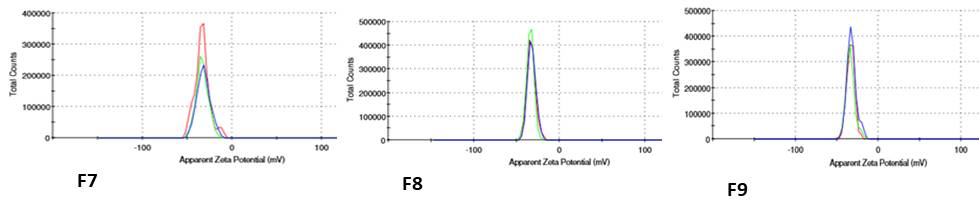
Figure 5. Zeta potential of ferrous ascorbate liposome F7, F8 and F9
Surface morphology
The scanning electron microscopic pictures of the liquid and dry form of the F8 formulation, were captured and studied for topographical properties (Perrie et al., 2010). The SEM pictures showed that the vesicles were well identified and are in a nearly perfect spherical in shape. Liquid vesicles were having smooth surface, and after lyophilization, they were formed as agglomerates with rough surface which are shown in Figure 6. The agglomerates of liposomes upon reconstitution with suitable solvent again reformed the sphere like shape.
Scanning electron microscopy (SEM) pictures and zeta size analysis of the optimized ferrous ascorbate liposomes (F8) showed that the vesicles were in the range of 200- 300nm. The vesicles were nearly spherical in shape with smooth surface.
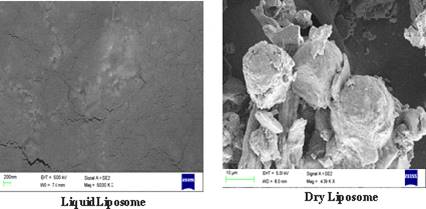
Figure 6. SEM pictures of ferrous ascorbate liquid and dry liposomes of F8 formulation
Table 4. Vesicle size, polydispersity (PDI) and zeta potential of ferrous ascorbate liquid liposomes
|
Formulation |
Vesicle size (nm) ± SD* |
Polydispersity index ± SD* |
Zeta potential (mV) ± SD* |
|
F7 |
286.8±9.23 |
0.30±0.04 |
-34±1.40 |
|
F8 |
307.23±8.78 |
0.43±0.04 |
-32±1.01 |
|
F9 |
279.7±19.18 |
0.36±0.01 |
-33±0.99 |
In vitro release study
The investigation for the in vitro release of the ferrous ascorbate of the formulation (F1-F9) was conducted for 8h. The %CDR at the end of 8h was found to be highest for F8, 85.54±1.16% and lowest for F7 formulation, 79.25±1.92% (Figure 7). The release of drug from liposomes depends upon the composition ratio of phosphatidyl choline and cholesterol in the formulation (Perrie et al., 2010). Decrease in drug release is due to the increased concentration of cholesterol in the bilayers of liposomes. As the concentration of cholesterol increases in the formulation, the drug release decreases proportionately (ICH, 2003).
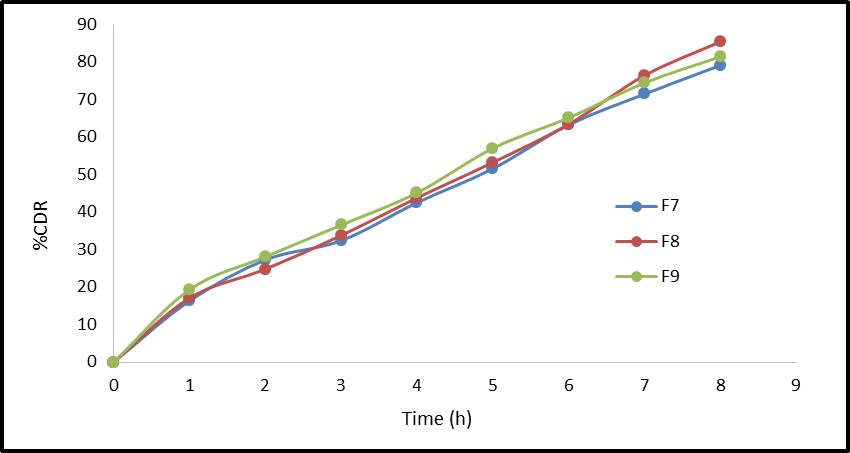
Figure 7. Drug release profile of ferrous ascorbate liquid liposomes F7, F8 and F9
Stability studies
The short term stability studies were carried out for the most satisfactory optimized formulation, at 40±2ºC, 75±5% RH for three months and the results are shown in Table 5. The sample was analyzed for drug content at the interval of 30 days to know any changes in the drug content. Results reveal that there was no significant difference between the initial time and the different time interval of stability study period. Hence, we conclude that the stability of prepared formulation is superior.
Table 5. Stability studies of optimized formulation
|
Evaluation parameter |
Sampling intervals |
|||
|
Day one |
30th day |
60th day |
90th day |
|
|
Drug content of ferrous ascorbate (F8) |
100% |
98.10% |
97.27% |
97.19% |
Conclusion
The present research was carried out to develop dry liposomes of iron for oral use. With the main objective of developing nano liposome of ferrous ascorbate to rectify the absorption and bioavailability of iron. Formulation procedure adopted in the study is simple, convenient and stable. Entrapment efficiency, and release pattern was found be steady and sustained for prolonged period of time. Due to sustained effect, iron releases slowly, side effects and over loading of iron can be minimized. The stability of dry liposome is comparable to any conventional liquid dosage forms. Therefore, from the study we conclude that the development of iron entrapped dry liposome can be used as ideal dosage form in the treatment of iron deficiency anemia.
Funding
This research was supported by the Rajiv Gandhi University of Health Sciences (RGUHS), Bengaluru. Project code P073, RGUHS.
Acknowledgements
The authors extend their appreciation to Rajiv Gandhi University of Health Sciences, Bengaluru, for supporting this work under the Advanced Research. Authors also appreciate the support extended by the Management, Acharya & BM Reddy College of Pharmacy, Bengaluru.
Conflict of interest: The authors declare no conflict of interest.
References
Anjali, Kaushik D. 2016. Microencapsulation of folic acid and ferrous ascorbate for oral administration. European Journal of Biomedical and Pharmaceutical Sciences, 3(8):293-304.
Burguera JL, Burguera M. 1984. Determination of iron (II) and iron (III) and total iron in solution using FIA and AAS. Analytica Chimica Acta, 161:375-79.
Carretero SN, Granados AMP, Sarria B, Vaquero MP. 2008. Iron absorption from meatpate fortified with ferric pyrophosphate in iron deficient women, 25(2009):20-24.
Chien YW. Concepts and system design for rate-controlled drug delivery. Novel drugdelivery system. 2nd ed. New York: Marcel Dekker Inc;1992. p. 142.
Dua JS, Rana AC, Bhandari AK. 2012. Liposomes: method of preparation and application. International Journal of Pharma Sciences and Research, 3(11):14-20.
Gautam SC, Saha L, Sekhri K, Saha PK. 2008. Deficiency in pregnancy and the rationality of iron supplements prescribed during pregnancy. Medscape Journal of Medicine, 10(12):283.
Greici A. Antunes, Heldiane S. dos Santos, Yara P. da Silva, Márcia M. Silva, Clarisse M. S. Piatnicki, Dimitrios Samios. 2017. Determination of Iron, Copper, Zinc, Aluminum, and Chromium in Biodiesel by Flame Atomic Absorption Spectrometry Using a Microemulsion Preparation Method. Energy Fuels 31, 3, 2944–2950.
Grit M, Crommelin DJA. 1993. Chemical stability of liposomes: implication for their physical stability. Chemistry and Physics of Lipids, 64(1-3):3-18.
Honary S, Zahir F. 2013. Effect of zeta potential on the properties of nano-drug delivery systems - a review. Tropical Journal of Pharmaceutical Research, 12(2):255-64.
ICH Q1A (R2), Stability testing guidelines: Stability testing of new drug substances and products. The European agency for the evaluation of medicinal products 2003; CPMP/ICH/2736/99:4-20.
Kumar A, Badde S, Kamble R, Pokharkar VB. 2010. Development and characterization of liposomal drug delivery system for nimesulide. International Journal of Pharmaceutical Sciences, 2:87-89.
Michelland SH, Minassian LT, Poly PA, Deltattre J, Puisieux F. 1984. Lyophillization andrehydration of liposomes. Colloids Surface, 14:269-76.
Miller LJ. 2013. Iron deficiency anemia: a common and curable disease. Cold Spring Harbor Perspectives in Medicine, 2013;3(7):a011866.
Panel Sagida Bibi, Randip Kaur, Malou Henriksen-Lacey, Sarah E. McNeil, Jitinder Wilkhu, Eric Lattmann, Dennis Christensen, AfzalR. Mohammed, Yvonne Perrie. 2011. Microscopy imaging of liposomes: From coverslips to environmental SEM. International Journal of Pharmaceutics, 417(1–2):138-150.
Perrie Y, Ali H, Kirby DJ, Mohammed AU, McNeil SE, Vangala A. 2010. Environmental scanning electron microscope imaging of vesicle systems. Methods in Molecular Biology, 606:319-31.
Pisoni A, Riccio E, Sobbaticai M, Andreuai M, Visciano B, Del Rio A. 2015. Effect of oral liposomal iron vs intravenous iron for treatment of iron deficiency anemia in CKD patients, a randomized trial. Nephrology, Dialysis and Transplantation 30(4)645-52.
Popovska O, Simonvka J, Kavrakovski Z, Lovska V R. 2013. An over view: methods forpreparation and characterization of liposomes drug delivery system. International Journal of Phytopharmacy Research, 3(2):13-20.
Savolainen SP, Jarinen T, Taipale H, Urtti A. 1997. Method for evaluating drug release from liposomes in sink condition. International Journal of Pharmaceutics, 159:27-33.
Scott SP, Edinboro LPC, Calelfield LE, Kolb L. 2014. The impact of anemia on children mortality: updated review. Nutrients, 6(12):5915-32.
Tinsley GM, Harty PS, Stratton MT, Siedler MR, Rodriguez C. 2022. Liposomal Mineral Absorption: A Randomized Crossover Trial. Nutrients, 14(16):3321.
Yang S, Guo Y. 2014. Preparation of lomustine-iohexol compound liposomes and the determination of entrapment efficiency. Journal of Chemical and Pharmaceutical Research, 6(1):402-7.
Yuan L, Geng L, Gel L, Yu P, Duan X, Chen Y et al. 2013. Effect of iron liposomes on anemia of inflammation. International Journal of Pharmaceutics, 454(1):82-9.


