Alok Pal Jain1*, Rajesh Singh Pawar2
1Dr. Hari Singh Gour University, Sagar (M.P.) India.
2Pharmacognosy and Phytochemistry Laboratory, VNS Institute of Pharmacy, Neelbud, Bhopal, MP, 462044, India
*Corresponding Author
Dr. Alok Pal Jain
Department of Pharmaceutical Sciences
Dr. Hari Singh Gour University, Sagar (M.P.) India.
Abstract
Objective: Phytochemical screening and HPTLC fingerprinting of different extracts of Alpinia galanga rhizomes. Materials and methods: Powdered dried rhizomes of Alpinia galanga was successively extracted with petroleum ether, chloroform and methanol. All extracts were qualitatively tested for presence of different chemical constituents. All extracts were run on HPTLC plates by using suitable solvent system and reports number of components with Rf values. Results: The tests confirmed the presence of phytosterols, trpenoids and fixed oils in petroleum ether extract. Chloroform extract confirmed the presence of alkaloids, and glycosides while methanol extract give positive test for tannins, flavonoids, amino acids and carbohydrates. Conclusion: The HPTLC method is used for qualitative and quantitative evaluation of herbal drug products. This method will be useful to standardized the product and impurity determination in Alpinia galanga and related products. HPTLC fingerprinting of different extracts were also confirmed the concentration of major compounds present in different extracts. Such finger printing is also applicable in differentiating the species from the adulterant and act as biochemical markers for Alpinia galanga in the pharmaceutical products.
Keywords: HPTLC fingerprinting, Alpinia galangal, phytochemical analysis
Introduction
With the advent of evolution, man is dependent on plants for a variety of his needs, namely sources of food materials, fuel, building materials, fibres, bulk chemicals, and also as medicines. The medicinal plants play an important role in the treatment of various disorders, as these are easily available. These plants are safe and effective products to use for peoples in treatment of various disorders (Kokate, 2001). Various medicinal plants having free radical scavenging molecules, such as vitamins, polyphenolic compounds, terpenoids, tannins, coumarins, alkaloids, amines and other metabolites, which has potent antioxidant activity (Cai et al., 2003). Many of these compounds have possessed anti-inflammatory, antitumor, antiatherosclerotic, antibacterial and antiviral activities. The therapeutic efficiency of the drugs depends on the genuine raw materials used. The assurance of safety, quality and subsequent efficacy of the herbal medicines has now become a major issue, and standardization of plant materials is required. In recent years, high performance chromatographic and spectral fingerprints have played an important role in the quality control of herbal medicines (Yamunadevi et al., 2011). The modern methods describing the identification and quantification of active components present in the plant material may be useful for standardization of herbal drug product.
Alpinia galanga (Zingiberaceae) is commonly known as Kulanjan is distributed in throughout of India and Southeast Asia. It is well and richest source of essential oils like cineole, ethyleugenol myrcene and methylcinnamate. It is also reported to presence of various flavonoids like galangin, alpinin, kampferide and 3-dioxy-4-methoxy flavones in rhizomes part (Cui, 2003). Traditionally it is used against rheumatism, bronchial catarrh, ulcers, throat infections, fever and dyspepsia. The rhizomes of the plant have been used in treatment of various ailments, such as stomach disorders, respiratory, cardiovascular and skin disorders (Chopra et al., 1956). Rhizomes have reported as antibacterial, antioxidant, immunostimulant, anti-protozoal, anti-fungal and expectorant action (Jain et al., 2012). The present study consists of preliminary phytochemical analysis and HPTLC fingerprinting of different extract of Alpinia galanga rhizomes.
Materials and methods
Collection and identification of plant materials
Plant material was procured from authorized vendor and authenticated at Department of Botany, Dr. Harisingh Gour Vishwavidyalaya, Sagar (M.P.). The drugs were first air dried and then in oven at temperature 40-60°C for about 45 minutes. The drugs were powdered to a moderately coarse powder and stored in an airtight container.
Extraction phytochemical analysis of plant material
The extraction process depends on the texture, water content of the plant material, nature of the compounds and also on the type to be isolated. The classical extraction process is continuous hot extraction of the powdered plant material in a Soxhlet apparatus or by cold maceration with a large range of solvents with increasing order of polarity like petroleum ether, chloroform and methanol (Harborne, 1973).
Weigh 350g of powdered drug was packed in soxhlet extractor separately and successively extracted with petroleum ether (60-80°C), chloroform and methanol. Each time the extraction was carried out for 25-30 cycles. To ensure complete extraction, a few drops collected from the thimble were found to have no residue on evaporation. The marc was dried in an oven before being extracted with next solvent. The extracts were then dried and weighed for yield calculation. Qualitative analysis of all extracts was done by different chemical test for alkaloids, glycosides, terpenoids, steroids, fats, flavonoids, carbohydrates, tannins and amino acids (Ronsenthaler, 1930; Peach and Tracey, 1955).
HPTLC fingerprinting
Standardized manufacturing procedures and suitable analytical tools are required to establish the necessary framework for quality control in herbals. Among those tools, separation techniques including high pergormace thin layer chromatography and capillary electrophoresis are the most widely used to establish reference fingerprints of herbs, against which raw materials can be evaluated and finished products can be evaluated. High performance thin layer chromatography (HPTLC) is a modern, powerful analytical technique with separation power, performance and reproducibility superior to classic TLC. HTLC plates with small particles sizes (3-5 µm) and precise instruments for each step of the chromatographic process (Sample application, chromatogram development, chromatogram evaluation). HPTLC provides the means not only for flexible screening procedures and qualitative analyses but also for demanding quantitative determinations. HPTLC features highly sensitive scanning densitometry and video technology for rapid chromatogram evaluation and documentation. Today most HPTLC instruments are computer controlled and can therefore, offer dramatically improved reproducibility of the analytical result. At same time HPTLC is still as flexible and user friendly as classic TLC, but provides even greater advantages.
Chromatographic conditions and sample preparation
The HPTLC of different extracts were carried out on a pre-coated silica gel plate (0.2 mm, Merck 60 F-254, Germany) as the stationary phase using methanol: chloroform: acetic acid: benzene in the ratio of (3: 17: 0. 4:2), as a mobile phase. Dried extract were dissolved in methanol (10 mg/ml) and filtered the solutions. The samples (10 μl) of fractions and standards were spotted in the form of bands with a 100 μl Hamilton syringe on pre-coated silica gel aluminum plate (10 cm ×10 cm) with the help of Linomat 5 applicator. The applicator was attached to the computer system, which was programmed through WIN CATS software. The linear ascending development was carried out in a 20 cm ×10 cm twin trough glass chamber saturated with the mobile phase. The developed plate was dried by hot air to evaporate solvents and placed in a UV chamber set at 254 nm. Spots were scanned in densitometer (CAMAG Scanner 3) under UV light at 254 nm. The Rf values and fingerprint data were recorded by WIN CATS software. The operating conditions were as follows: syringe delivery speed:10 s/μl; injection volume:10 μl; band width:6 mm; space between two bands:15 mm; start position:15 mm; lamp:D2 and distance from bottom of plate:15 mm.
Sample analysis
All samples were applied as bands of each extract (4mm in length and 1µl in concentration) using Linomat 5 applicator attached to CAMAG HPTLC system, which was programmed through WIN CATS software. Samples were applied in duplicate on pre-coated silica gel 60F254 aluminium sheets (5 x 10 cm). After the sample application the plate was run by mobile phase Benzene: chloroform: methanol (11:9:2) in Twin trough glass chamber 10x 10 cm saturated with mobile phase for 15 min before plate running. After mobile phae run the air-dried plate was viewed in ultraviolet light to observe the number of spots (Figure 1). The chromatograms were scanned by densitometer at 254 and 365nm. The Rf values and finger print data were recorded by WIN CATS software.
Results and discussion
Phytochemical screening
The yields for Alpinia galanga 2.1 % w/w of crude drug of petroleum ether extract of light colour 1.6 % w/w of crude drug of chloroform extract with light brown colour solid mass and 3.5 % w/w of crude drug of methanolic extract with brown colour semisolid mass. Petrolium ether extract contains terpenoids, fatty acids and steroids. Chloroform extract confirmed the presence of alkaloids and glycosides. Methanolic extract revealed the presence of flavonoids, glycosides and tannins.
HPTLC fingerprinting
The chromatographic (TLC) profiles were developed utilizing different solvent systems. The best resolution for petroleum ether extracts of Alpinia galanga were observed in benzene: ethyl acetate in the ratio of 3:0.1(v/v); Seven to twelve spots were seen (Table 1). Chloroform extracts of Alpinia galanga showed good resolution in methanol: chloroform: acetic acid: benzene in the ratio of 3:17:0.4:2 (v/v) and five to eight spots were seen (Table 2). Similarly, the resolution was good in ethyl acetate: n-butanol: formic acid: water in the ratio of 5:3:1:1 (v/v) for methanolic extracts of Alpinia galanga which showed three to nine spots clearly (Table 3).
Table 1. HPTLC profile of petroleum ether extract of Alpinia galanga at 254 nm
|
Peaks |
Start Position (Rf) |
Start Height (AU) |
Max position (Rf) |
Max Height (AU) |
End Position (Rf) |
End Height (AU) |
Area (AU) |
Area (%) |
|
1 |
0.01 |
52.6 |
0.01 |
53.2 |
0.02 |
0.4 |
350.9 |
1.24 |
|
2 |
0.05 |
0.3 |
0.10 |
83.3 |
0.13 |
10.7 |
2703.5 |
9.56 |
|
3 |
0.15 |
2.5 |
0.18 |
244.6 |
0.21 |
10.6 |
5990.5 |
21.19 |
|
4 |
0.25 |
32.8 |
0.29 |
85.3 |
0.33 |
1.7 |
3004.4 |
10.63 |
|
5 |
0.37 |
7.7 |
0.41 |
32.9 |
0.45 |
10.7 |
1298.9 |
4.59 |
|
6 |
0.59 |
2.2 |
0.65 |
64.4 |
0.70 |
2.4 |
2766.1 |
9.78 |
|
7 |
0.83 |
68.4 |
0.87 |
326.7 |
0.90 |
15.8 |
12156.7 |
43.0 |
Table 2. HPTLC profile of chloroform extract of Alpinia galanga at 254 nm
|
Peaks |
Start Position (Rf) |
Start Height (AU) |
Max position (Rf) |
Max Height (AU) |
End Position (Rf) |
End Height (AU) |
Area (AU) |
Area (%) |
|
1 |
0.47 |
15.1 |
0.49 |
43.3 |
0.53 |
14.5 |
1275.8 |
16.20 |
|
2 |
0.54 |
8.9 |
0.55 |
10.7 |
0.57 |
2.4 |
174.6 |
2.22 |
|
3 |
0.60 |
6.4 |
0.66 |
63.9 |
0.68 |
55.3 |
2385.1 |
30.28 |
|
4 |
0.68 |
55.1 |
0.72 |
74.7 |
0.74 |
66.4 |
2546.8 |
32.33 |
|
5 |
0.74 |
66.4 |
0.75 |
71.4 |
0.79 |
11.7 |
1495.4 |
18.98 |
Table 3. HPTLC profile of methanolic extract of Alpinia galanga at 254 nm
|
Peaks |
Start Position (Rf) |
Start Height (AU) |
Max position (Rf) |
Max Height (AU) |
End Position (Rf) |
End Height (AU) |
Area (AU) |
Area (%) |
|
1 |
0.19 |
1.4 |
0.23 |
15.4 |
0.24 |
11.4 |
212.1 |
18.5 |
|
2 |
0.25 |
8.8 |
0.26 |
14.6 |
0.30 |
4.2 |
178.4 |
15.27 |
|
3 |
0.64 |
1.3 |
0.70 |
33.7 |
0.77 |
0.7 |
777.7 |
66.57 |
After preliminary TLC detection and development of suitable mobile phases, HPTLC analysis was carried out. The HPLTC profile of petroleum ether extract of Alpinia galanga (AG) (100µg/5µL) was applied as a spot on HPTLC plate. The HPTLC profile of petroleum ether extract of AG showed the presence of seven spots, the maximum concentration was found to be of compound 7 at Rf value 0.87 (43 µg) (Figure 1).
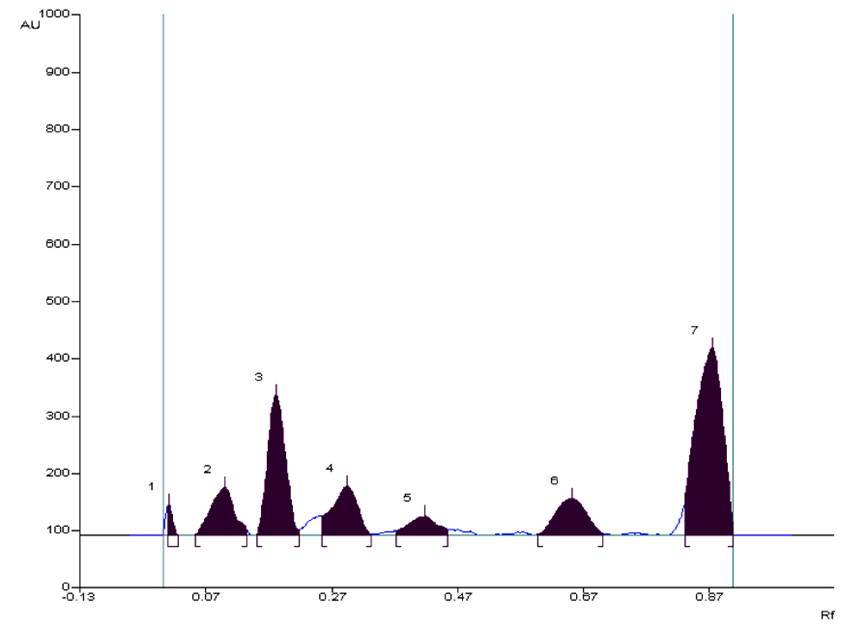
Figure 1. HPTLC Chromatogram of petroleum ether extract of Alpinia galanga at 254 nm
The prepared sample (100µg/5µL) of chloroform extract of AG was applied as a spot on HPTLC plate. The HPTLC profile of chloroform extract of AG revealed the presence of five spots at, the maximum concentration was found to be of component 4 at Rf 0.72 (32.33 µg) (Figure 2).
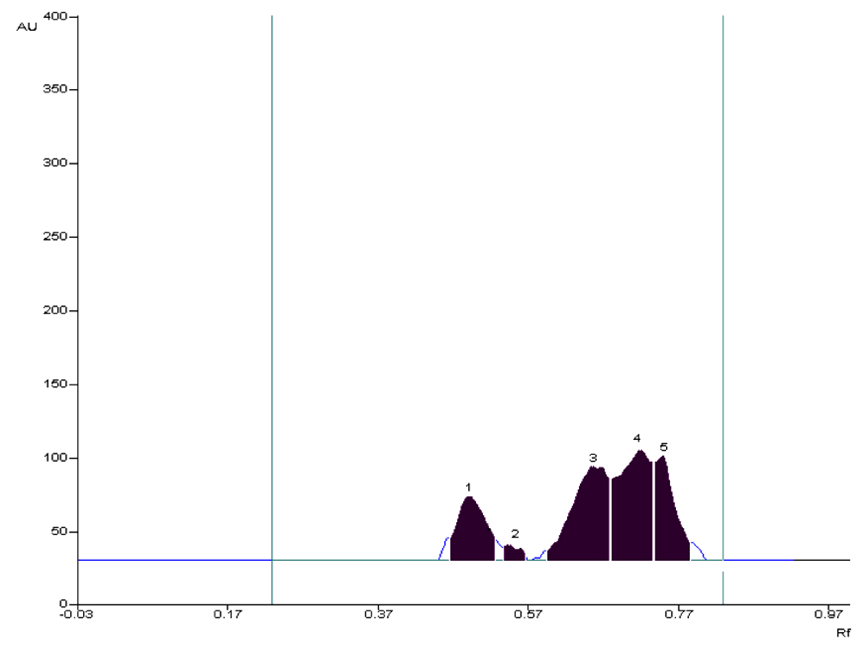
Figure 2. HPTLC Chromatogram of chloroform extract of Alpinia galanga at 254 nm
The prepared sample (100µg/5µL) of methanolic extract of AG was applied as a spot on TLC plate. The HPTLC profile of methanolic extract of AG showed the three spots, the maximum concentration was found to be of component 3 at Rf 0.70 (66.57 µg) (Figure 3).
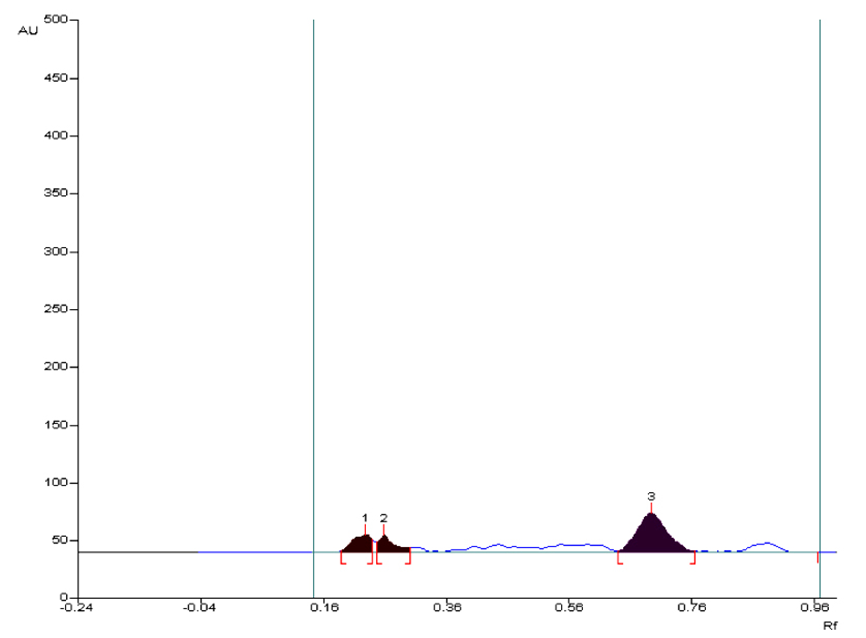
Figure 3. HPTLC Chromatogram of methanolic extract of Alpinia galanga at 254 nm
Conclusion
Preliminary phytochemical study of different extract i.e. petroleum ether extract showed the presence of terpenoids, fatty acids and steroids, chloroform extract contains alkaloids and glycosides and methanol extract confirmed the presence of flavonoids, glycosides and tannins. The HPTLC method is used for qualitative and quantitative evaluation of herbal drug products. This method will be useful to standardized the product and impurity determination in Alpinia galanga and related products. HPTLC fingerprinting of different extracts were also confirmed the concentration of major compounds present in different extracts. On the basis of HPTLC fingerprint of extract can be select a particular extract for the biological evaluation. Such finger printing is also applicable in differentiating the species from the adulterant and act as biochemical markers for Alpinia galanga in the pharmaceutical products.Figure 3.
Acknowledgments
Authors are grateful for the Head, Department of Botany, Dr. H. S. Gour University to provide facility for plant authentification.
Conflict of interest
Authors did not have any conflict of interest.
References
Brain KR, Turner TD, 1975. The Practical Evaluation of Phytopharmaceuticals. Wright-Scientenica, Bristol, pp. 153.
Cai YZ, Sun M, Corke H. Antioxidant activity of betalains from plants of the Amaranthaceae. J Agric Food Chem. 2003;51:2288-e2294.
Chopra RN, Nayer SL, Chopra IC. 1956. Glossary of Indian Medicinal Plants. Council of Scientific and Industrial Research, New Delhi.
Cui Z. 2003. Determination of chemical constituents of the essential oil from Alpinia galanga (L.) by GCMS. Lixueban, 38: 104-107.
Finar IL, 1959. Organic Chemistry. 2nd Ed., The English Language Book Society, London, pp. 280-431.
Handa SS, Kapoor VK, 2000. Pharmacognosy. 11th Reprint Ed., Vallabh Prakashan, Delhi, pp. 112-115.
Harborne JB, 1973. Phytochemical Methods (A guide to Modern Techniques of Plant Analysis). 1st Ed., Chapman and Hall, London, pp. 114-115.
Hawk PB, Oster BL, Summerson WH, 1954. The Practical Physiological Chemistry. 13th Ed., McGraw Hill Book Co., pp. 111.
Heffman, E, 1966. Chromatography. International Student Edition, 2nd Ed., 1966, pp. 165-174.
Jain AP, Pawar RS, Lodhi S, Singhai AK. 2012. Immunomodulatory and anti-oxidant potential of Alpinia galanga Linn. rhizomes. Pharmacognosy Communications, 2(3):30-37.
Kokate CK, Purohit AP, Gokhale SB, 2001. Text Book of Pharmacognosy. 7th Ed., Nirali Prakashan, India, pp. 133-166, 167-254, 255-269, 272-310, 428-523.
Middeltone H, 1956. Systematic Qualitative Analysis. Edward Arnold Publishers Ltd., London, pp. 91-94.
Peach T, Tracey MV, 1955. Modern Methods in Plant Analysis. Springer Verlog, Berlin, pp. 387.
Ronsenthaler L, 1930. Chemical investigations of plants. G. Bell and Sons, London, pp. 23-29, 119-132.
Shellard EJ, 1957. Practical Plant Chemistry for Pharmacy Students. Pitman Medical Publishing Co. Ltd., London, pp. 34-80.
Stahl E, 1965. Thin Layer Chromatography. Inter Sciences Publisher, Academic Press, New York, pp. 249-276.
Stahl E, 1973. Drug Analysis by Chromatography and Microscopy. Ann Arbor Sciences Publishers, pp. 97-160.
Thischer JN, Baitsholts AD, Thin Layer Chromatography: Why and How”, American Laboratory, New York, pp. 72.
Wallis TE, 1985. Text Book of Pharmacognosy. 5th Ed., CBS Publishers and Distributors, New Delhi, pp. 80.
Yamunadevi M, Wesely EG, Johnson MA. 2011. A chromatographic study on the glycosides of Aerva lanata L. Chinese Journal of Natural Medicines, 9: 210-214.


